Technical Analysis of AMID 2024-05-10
Overview:
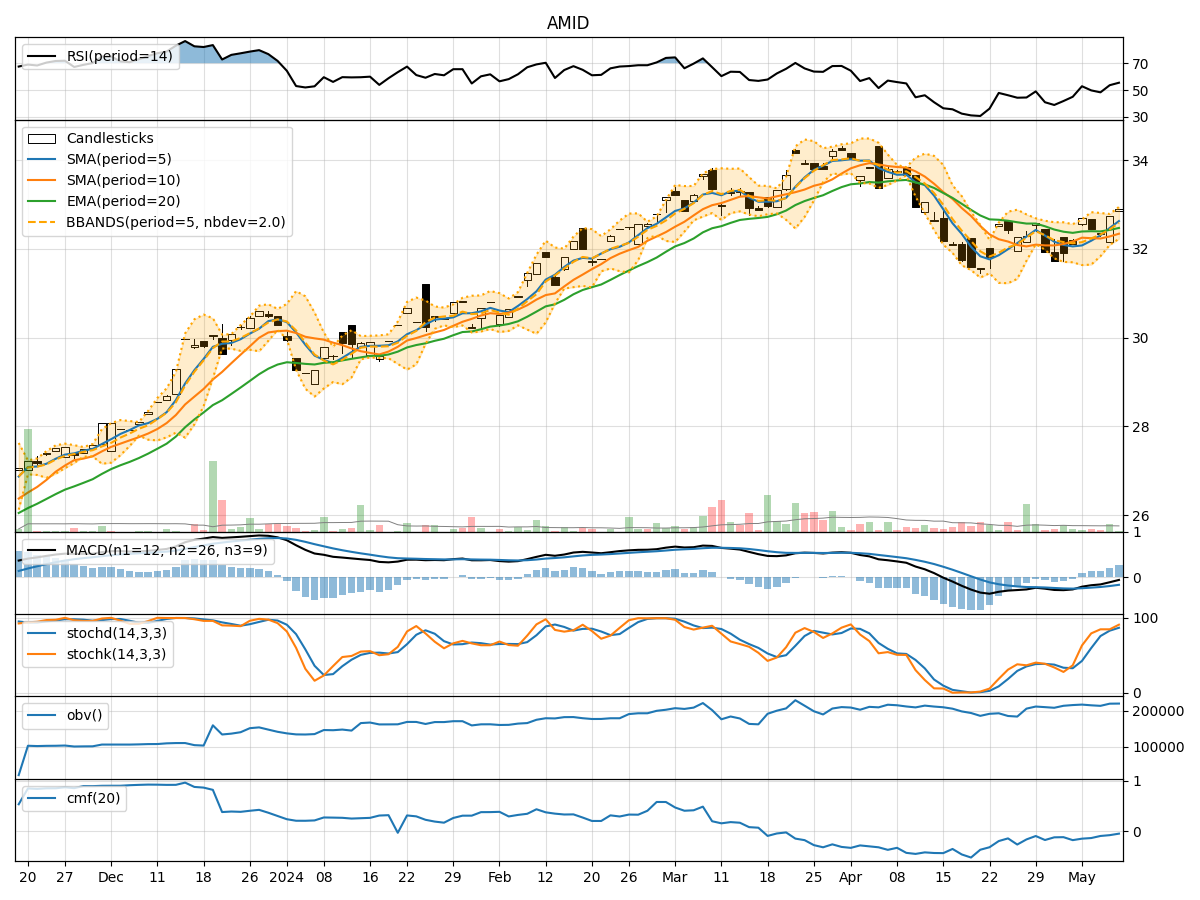
In analyzing the technical indicators for AMID over the last 5 days, we will delve into the trend, momentum, volatility, and volume indicators to provide a comprehensive outlook on the possible stock price movement. By examining these key factors, we aim to offer valuable insights and predictions for the upcoming days.
Trend Indicators:
- Moving Averages (MA): The 5-day MA has been trending above the closing prices, indicating a short-term uptrend.
- MACD: The MACD line has been consistently below the signal line, suggesting a bearish momentum.
- EMA: The EMA has been fluctuating around the closing prices, reflecting a neutral trend.
Key Observation: The moving averages indicate a slight bullish sentiment, while the MACD signals a bearish momentum.
Momentum Indicators:
- RSI: The RSI has been oscillating around the 50 level, indicating a neutral momentum.
- Stochastic Oscillator: Both %K and %D have been in overbought territory, suggesting a potential reversal.
- Williams %R: The Williams %R has shown oversold conditions on some days.
Key Observation: The momentum indicators are mixed, with some pointing towards a potential reversal.
Volatility Indicators:
- Bollinger Bands: The stock price has mostly stayed within the bands, indicating moderate volatility.
- Bollinger %B: The %B has fluctuated around 0.5, suggesting a balanced market sentiment.
Key Observation: Volatility has been relatively stable, with no extreme movements detected.
Volume Indicators:
- On-Balance Volume (OBV): The OBV has shown a slight decline, indicating some distribution.
- Chaikin Money Flow (CMF): The CMF has been negative, signaling selling pressure.
Key Observation: Volume indicators suggest a mild bearish sentiment due to the decrease in OBV and negative CMF.
Conclusion:
Based on the analysis of the technical indicators, the stock price of AMID is likely to experience sideways movement in the next few days. The trend indicators show a slight bullish bias, while momentum indicators are mixed, indicating a potential reversal. Volatility remains stable, and volume indicators suggest a mild bearish sentiment. Therefore, it is recommended to exercise caution and closely monitor the price action for any potential shifts in market sentiment.