Technical Analysis of AMJ 2024-05-10
Overview:
In analyzing the technical indicators for AMJ over the last 5 days, we will delve into the trend, momentum, volatility, and volume indicators to provide a comprehensive outlook on the possible stock price movement in the coming days. By examining these key aspects, we aim to offer valuable insights and predictions to guide your investment decisions.
Trend Analysis:
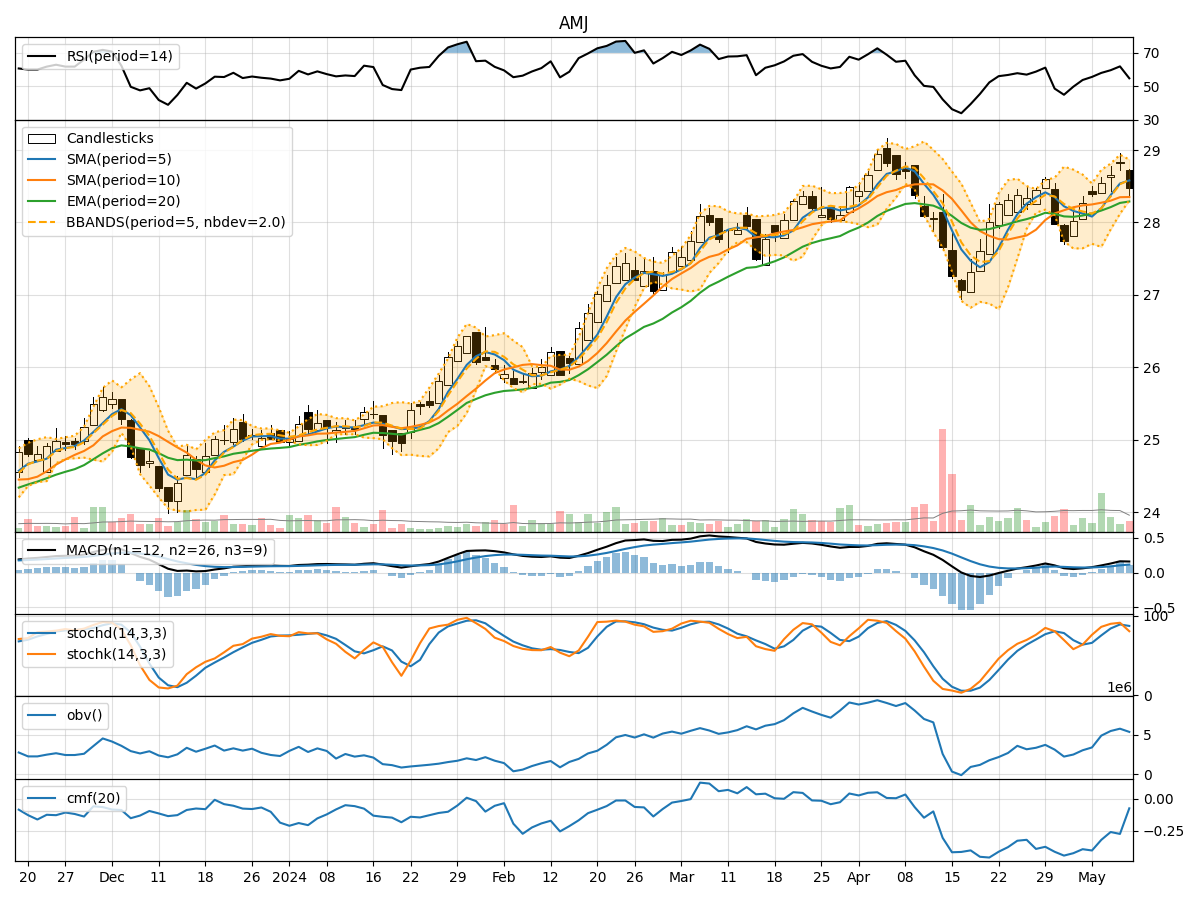
- Moving Averages (MA): The 5-day Moving Average (MA) has been consistently above the Simple Moving Average (SMA) and Exponential Moving Average (EMA), indicating a bullish trend.
- MACD: The MACD line has been consistently above the signal line, with both lines showing an upward trend, suggesting bullish momentum.
Momentum Analysis:
- RSI: The Relative Strength Index (RSI) has been gradually increasing and is currently in the neutral zone, indicating potential for further price movement in either direction.
- Stochastic Oscillator: Both %K and %D have been relatively high, suggesting overbought conditions in the short term.
Volatility Analysis:
- Bollinger Bands (BB): The stock price has been trading within the upper Bollinger Band, indicating increased volatility and a potential for a price reversal.
Volume Analysis:
- On-Balance Volume (OBV): The OBV has been fluctuating, indicating indecision among investors regarding the stock.
- Chaikin Money Flow (CMF): The CMF has been negative, suggesting selling pressure in the market.
Key Observations:
- The trend indicators suggest a bullish sentiment in the short term.
- Momentum indicators show a potential for a price correction due to overbought conditions.
- Volatility indicators point towards increased price fluctuations.
- Volume indicators reflect uncertainty and selling pressure in the market.
Conclusion:
Based on the analysis of the technical indicators, the next few days' possible stock price movement for AMJ is likely to experience a short-term correction or consolidation. The bullish trend may face resistance due to overbought conditions and increased volatility. Investors should exercise caution and consider potential profit-taking opportunities in the near future. A sideways movement or a slight downward correction could be anticipated in the coming days.
Recommendation:
Given the current market dynamics, it is advisable for investors to closely monitor the price action and key technical levels. Consider setting stop-loss orders to manage risk and capitalize on potential opportunities that may arise. Additionally, staying informed about any significant news or events that could impact the stock's performance is crucial for making well-informed investment decisions.