Technical Analysis of AMJB 2024-05-10
Overview:
In analyzing the technical indicators for AMJB over the last 5 days, we will delve into the trend, momentum, volatility, and volume indicators to provide a comprehensive outlook on the possible stock price movement. By examining these key aspects, we aim to offer valuable insights and predictions for the upcoming days.
Trend Analysis:
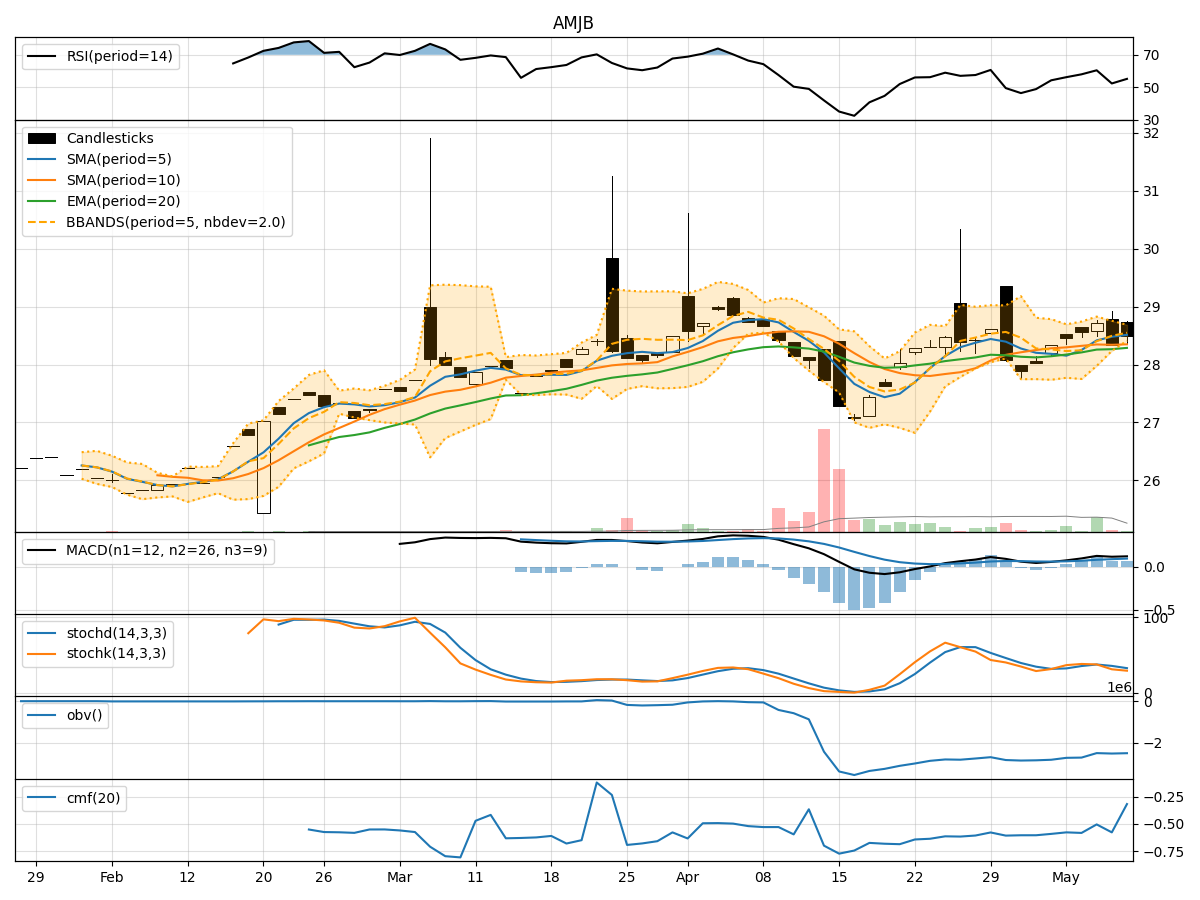
- Moving Averages (MA): The 5-day Moving Average (MA) has been consistently above the closing prices, indicating a short-term uptrend.
- MACD: The MACD line has been positive and increasing, suggesting bullish momentum in the stock.
- EMA: The Exponential Moving Average (EMA) has been trending upwards, supporting the bullish sentiment in the short to medium term.
Key Observation: The trend indicators point towards a bullish outlook for AMJB.
Momentum Analysis:
- RSI: The Relative Strength Index (RSI) has been fluctuating around the neutral zone, indicating a balanced momentum.
- Stochastic Oscillator: Both %K and %D have been oscillating within a range, reflecting a lack of strong momentum.
- Williams %R: The Williams %R is in the oversold territory, suggesting a potential reversal.
Key Observation: The momentum indicators suggest a sideways movement or a potential reversal in the near future.
Volatility Analysis:
- Bollinger Bands: The Bollinger Bands have been relatively narrow, indicating low volatility in the stock price.
- Bollinger %B: The %B indicator has been hovering around the middle band, signaling a lack of extreme price movements.
Key Observation: Volatility indicators point towards a consolidation phase with limited price fluctuations.
Volume Analysis:
- On-Balance Volume (OBV): The OBV has been fluctuating but has not shown a clear trend, suggesting mixed sentiment among investors.
- Chaikin Money Flow (CMF): The CMF has been negative, indicating selling pressure in the stock.
Key Observation: Volume indicators reflect a neutral stance with no clear direction in investor sentiment.
Conclusion:
Based on the analysis of trend, momentum, volatility, and volume indicators, the overall outlook for AMJB in the next few days is neutral to slightly bullish. While the trend indicators support a bullish view, the momentum and volume indicators suggest a more cautious approach due to the lack of strong momentum and mixed volume signals. The low volatility indicates a consolidation phase, which may precede a potential breakout in either direction.
In conclusion, the stock is likely to experience a period of consolidation with a slight upward bias, but investors should closely monitor key support and resistance levels for potential trend reversals.