Technical Analysis of AMNA 2024-05-10
Overview:
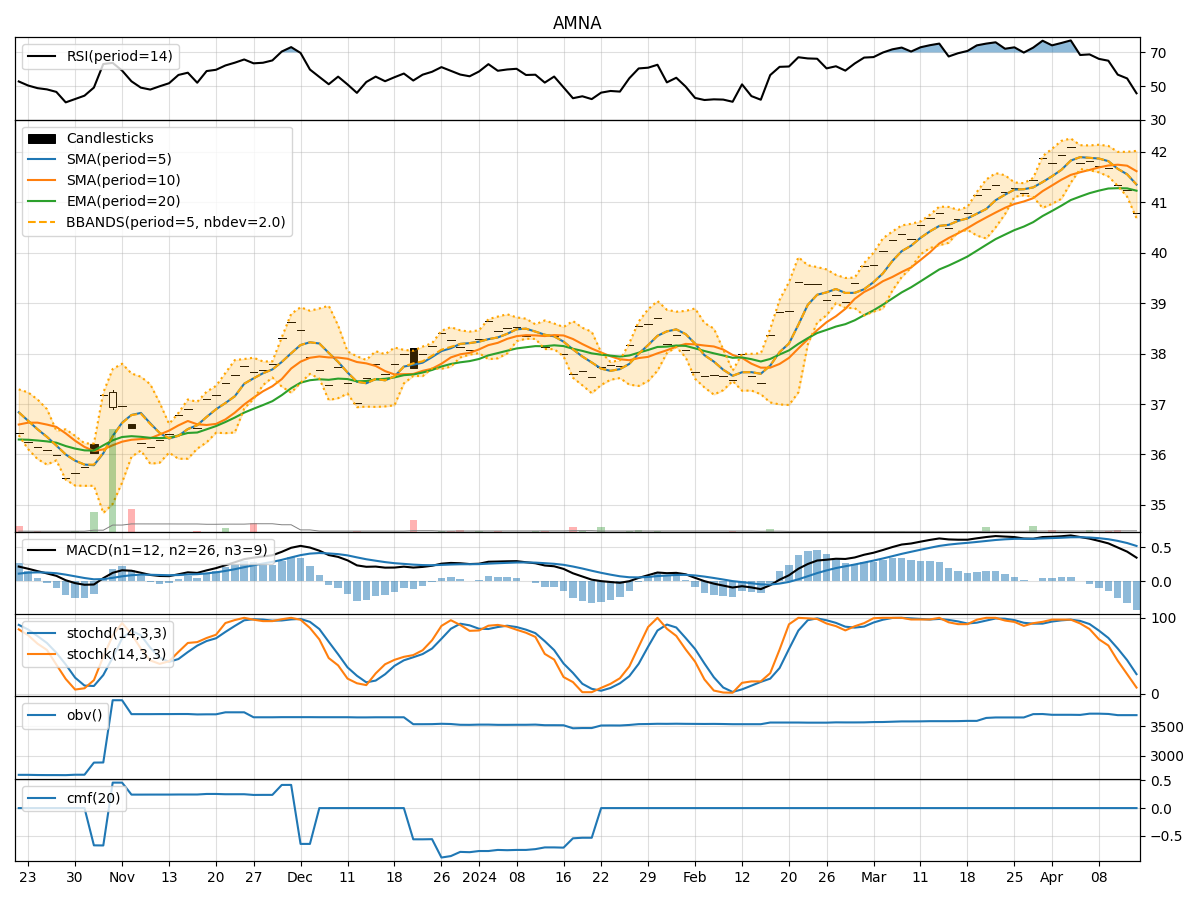
In analyzing the technical indicators for AMNA over the last 5 days, we will delve into the trend, momentum, volatility, and volume indicators to provide a comprehensive outlook on the possible stock price movement in the coming days. By examining key metrics such as moving averages, MACD, RSI, Bollinger Bands, and volume trends, we aim to offer valuable insights and predictions for potential price action.
Trend Indicators:
- Moving Averages (MA): The 5-day moving average has been consistently rising, indicating a bullish trend in the short term.
- MACD: The MACD line has been above the signal line, with both lines showing an upward trajectory, suggesting bullish momentum.
- EMA: The exponential moving average has also been trending upwards, supporting the bullish sentiment.
Momentum Indicators:
- RSI: The Relative Strength Index has been increasing and is currently in the overbought territory, signaling strong buying momentum.
- Stochastic Oscillator: Both %K and %D have been in the overbought zone, indicating a strong upward momentum.
- Williams %R: The indicator is in the oversold region, suggesting a potential reversal or consolidation.
Volatility Indicators:
- Bollinger Bands: The stock price has been trading near the upper Bollinger Band, indicating high volatility and a potential overbought condition.
- Bollinger Band Width: The band width has been narrowing, which could signal a period of consolidation or a potential reversal in price direction.
Volume Indicators:
- On-Balance Volume (OBV): The OBV has been steadily increasing, reflecting strong buying pressure and accumulation of the stock.
- Chaikin Money Flow (CMF): The CMF has been flat at 0.0, indicating a balance between buying and selling pressure.
Key Observations and Opinions:
- Trend: The trend indicators suggest a strong bullish sentiment in the short term.
- Momentum: Momentum indicators point towards a continuation of the bullish momentum, although some indicators are in the overbought region.
- Volatility: High volatility near the upper Bollinger Band could indicate a potential pullback or consolidation.
- Volume: Increasing OBV signals accumulation, while the flat CMF indicates a balance between buying and selling pressure.
Conclusion:
Based on the analysis of the technical indicators, the next few days for AMNA are likely to see continued upward movement in the stock price. However, given the overbought conditions in some momentum indicators and high volatility near the upper Bollinger Band, we may also experience a period of consolidation or a minor pullback before potentially resuming the uptrend. Traders should closely monitor key levels and be prepared for potential reversals in price action.