Technical Analysis of AMND 2024-05-10
Overview:
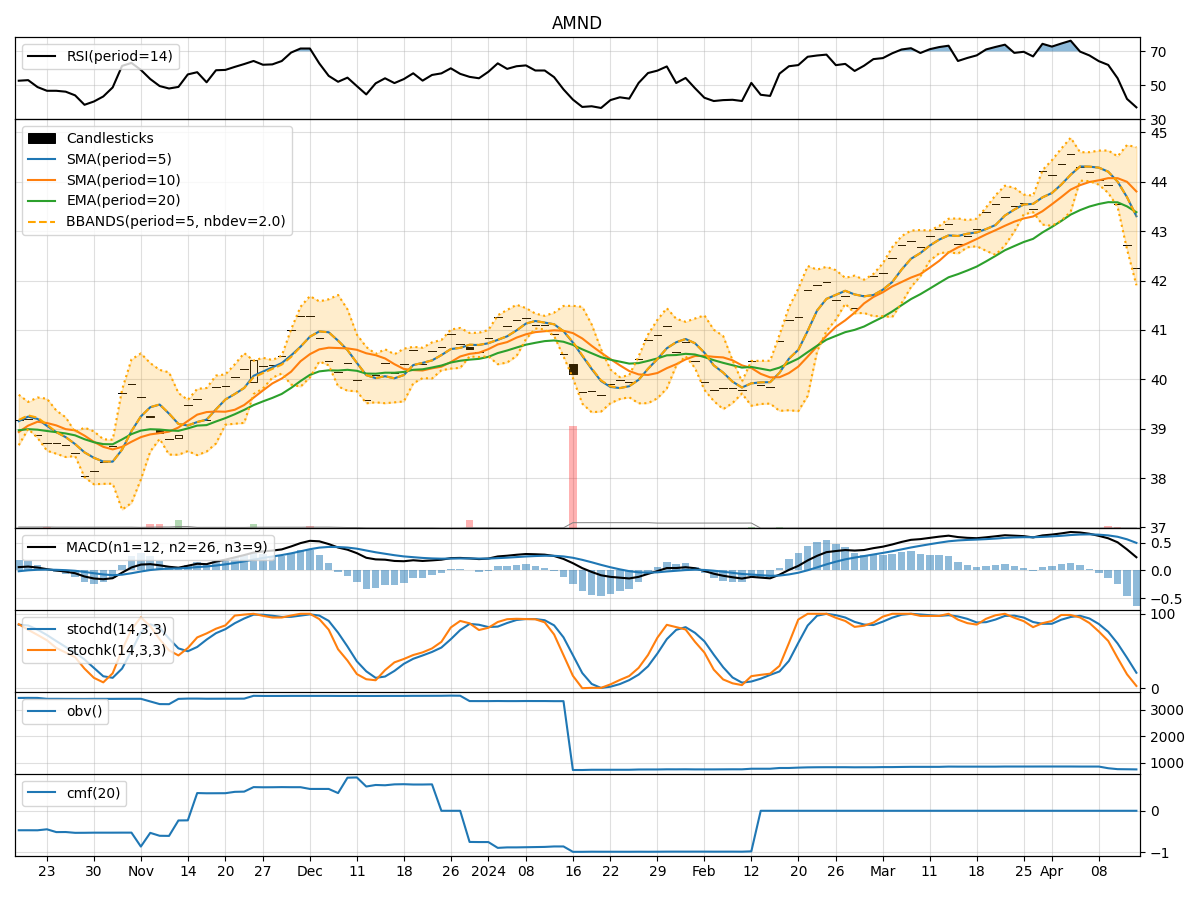
In analyzing the technical indicators for AMND over the last 5 days, we will delve into the trend, momentum, volatility, and volume indicators to provide a comprehensive outlook on the possible stock price movement in the coming days. By examining key metrics such as moving averages, MACD, RSI, Bollinger Bands, and OBV, we aim to offer valuable insights and recommendations for potential trading strategies.
Trend Indicators:
- Moving Averages (MA): The 5-day moving average has been consistently above the 10-day simple moving average, indicating a short-term bullish trend.
- MACD: The MACD line has been trending upwards, staying above the signal line, suggesting bullish momentum.
- EMA: The exponential moving average has been steadily increasing, supporting the bullish sentiment in the short to medium term.
Momentum Indicators:
- RSI: The Relative Strength Index has been rising and is currently in the overbought territory, signaling strong buying momentum.
- Stochastic Oscillator: Both %K and %D have been at 100%, indicating strong upward momentum.
- Williams %R: The indicator is at 0.0, reflecting a potential overbought condition.
Volatility Indicators:
- Bollinger Bands: The stock price has been trading close to the upper Bollinger Band, suggesting high volatility and a potential overbought condition.
- Bollinger Band Width: The band width has been narrowing, indicating a decrease in volatility and a possible upcoming price breakout.
Volume Indicators:
- On-Balance Volume (OBV): The OBV has been declining, suggesting a decrease in buying pressure despite the rising stock price.
- Chaikin Money Flow (CMF): The CMF has been consistently at 0.0, indicating a neutral money flow trend.
Key Observations and Opinions:
- Overall Sentiment: The technical indicators collectively point towards a strong bullish sentiment in the short term, supported by the uptrend in moving averages, MACD, RSI, and Stochastic Oscillator.
- Volatility: While the Bollinger Bands indicate high volatility, the narrowing band width suggests a potential decrease in volatility and a consolidation phase.
- Volume: The declining OBV raises concerns about the sustainability of the bullish trend, as decreasing volume may lead to a reversal in price direction.
Conclusion:
Based on the analysis of the technical indicators, the next few days for AMND are likely to see continued upward movement in the stock price, driven by strong momentum and bullish sentiment. However, traders should remain cautious of a possible price consolidation or reversal, especially considering the declining OBV and potential decrease in volatility. It is advisable to closely monitor key support and resistance levels for timely decision-making and risk management strategies.