Technical Analysis of AMOM 2024-05-10
Overview:
In analyzing the technical indicators for AMOM stock over the last 5 days, we will delve into the trend, momentum, volatility, and volume indicators to provide a comprehensive outlook on the possible stock price movement in the coming days. By examining these key indicators, we aim to offer valuable insights and predictions for potential investors.
Trend Analysis:
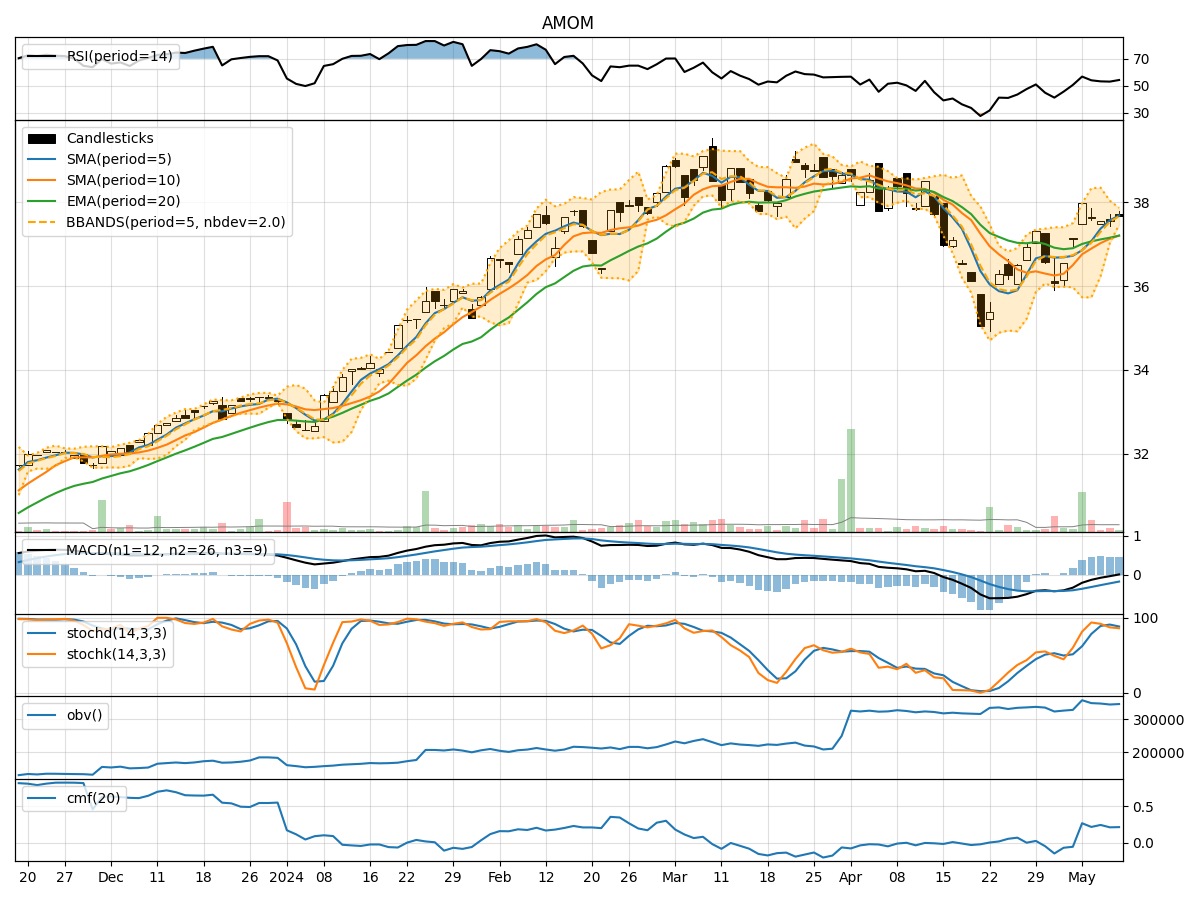
- Moving Averages (MA): The 5-day MA has been consistently above the closing prices, indicating a short-term uptrend.
- MACD: The MACD line has been gradually increasing, with the MACD histogram showing positive values, suggesting bullish momentum.
- RSI: The RSI values have been fluctuating around the 50 level, indicating a neutral stance in terms of momentum.
Key Observation: The trend indicators suggest a bullish sentiment in the short term.
Momentum Analysis:
- Stochastic Oscillator: Both %K and %D values have been declining, indicating a potential reversal in momentum.
- Williams %R: The indicator has been hovering in the oversold territory, signaling a possible buying opportunity.
Key Observation: Momentum indicators are showing signs of a potential reversal or consolidation.
Volatility Analysis:
- Bollinger Bands (BB): The bands have been narrowing, suggesting decreasing volatility in the stock.
- Bollinger %B: The %B value has been around 0.5, indicating the stock is trading at the middle of the bands.
Key Observation: Volatility is decreasing, and the stock is consolidating within the Bollinger Bands.
Volume Analysis:
- On-Balance Volume (OBV): The OBV has been relatively stable, indicating a balance between buying and selling pressure.
- Chaikin Money Flow (CMF): The CMF has been positive but fluctuating, suggesting some buying interest.
Key Observation: Volume indicators reflect a neutral sentiment with no clear direction.
Conclusion:
Based on the analysis of the technical indicators, the stock price of AMOM is likely to experience sideways movement in the coming days. The trend indicators point towards a bullish bias in the short term, while momentum indicators suggest a potential reversal or consolidation. Volatility is decreasing, indicating a consolidation phase, and volume indicators show a neutral stance.
Overall, the stock is expected to trade within a range with a slight upward bias, but investors should remain cautious of potential reversals in momentum.