Technical Analysis of AMPD 2024-05-10
Overview:
In analyzing the technical indicators for AMPD over the last 5 days, we will delve into the trend, momentum, volatility, and volume indicators to provide a comprehensive outlook on the possible stock price movement in the coming days. By examining these key aspects, we aim to offer valuable insights and predictions for potential investors.
Trend Indicators:
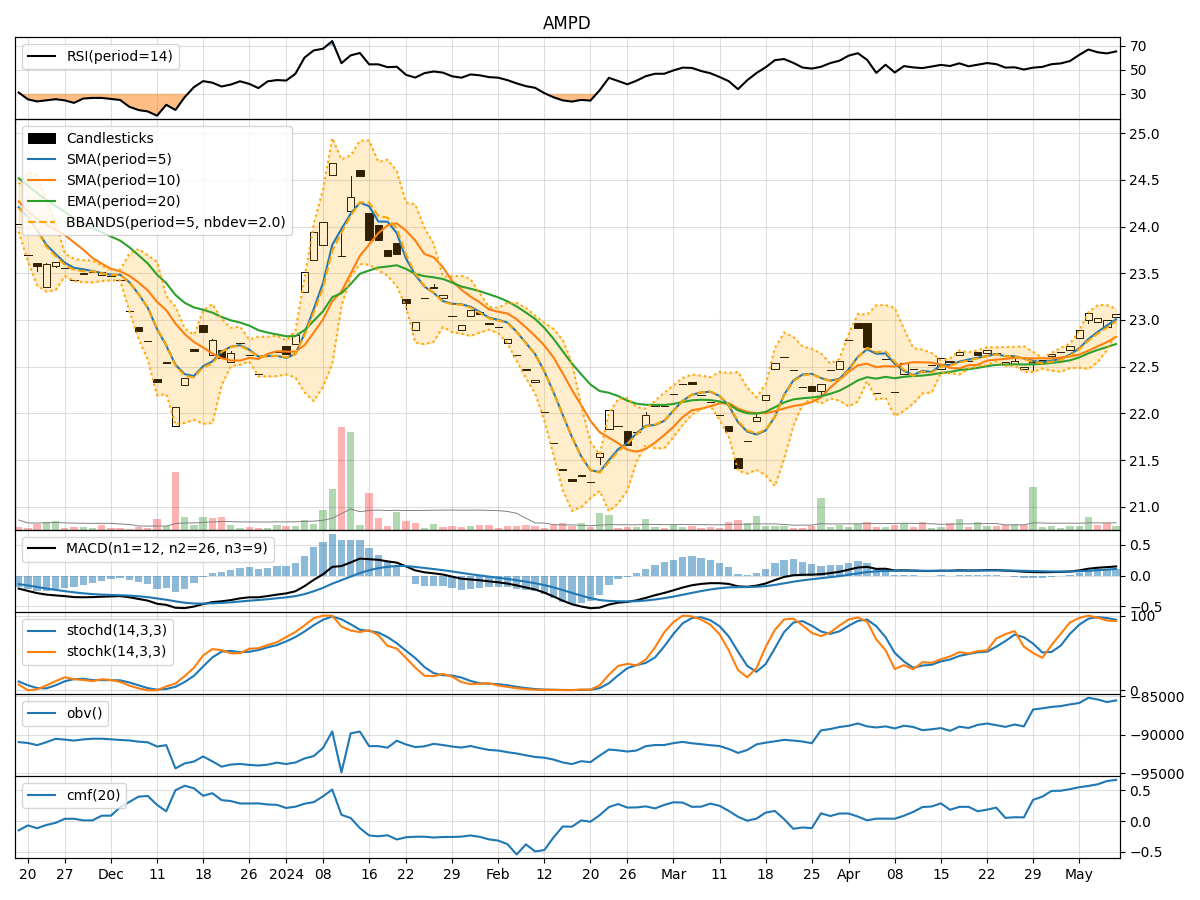
- Moving Averages (MA): The 5-day Moving Average has been consistently above the Simple Moving Average (SMA) and Exponential Moving Average (EMA), indicating a bullish trend.
- MACD: The MACD line has been consistently above the signal line, with both lines showing an upward trend, suggesting bullish momentum.
- RSI: The Relative Strength Index (RSI) has been fluctuating in the overbought territory, indicating strong buying pressure.
Momentum Indicators:
- Stochastic Oscillator: Both %K and %D have been relatively high, suggesting that the stock is in overbought territory.
- Williams %R: The Williams %R is also indicating an overbought condition.
Volatility Indicators:
- Bollinger Bands: The stock price has been trading within the upper Bollinger Band, indicating an increased level of volatility.
- Volatility Bands: The width of the bands has been expanding, suggesting higher volatility in the stock.
Volume Indicators:
- On-Balance Volume (OBV): The OBV has been showing a positive trend, indicating accumulation by investors.
- Chaikin Money Flow (CMF): The CMF has been consistently positive, suggesting strong buying pressure.
Key Observations:
- The trend indicators point towards a bullish sentiment, with moving averages and MACD signaling an upward trend.
- Momentum indicators indicate an overbought condition, suggesting a potential reversal or consolidation.
- Volatility indicators show an increase in price fluctuations, which could lead to sharp movements in either direction.
- Volume indicators reflect positive accumulation and buying pressure in the stock.
Conclusion:
Based on the analysis of the technical indicators, the next few days' possible stock price movement for AMPD is likely to be sideways to slightly bearish. While the trend indicators signal a bullish sentiment, the overbought conditions indicated by momentum indicators and the increased volatility levels suggest a potential pullback or consolidation in the stock price. Investors should closely monitor key support and resistance levels for potential entry or exit points.