Technical Analysis of AMTR 2024-05-10
Overview:
In analyzing the technical indicators for AMTR over the last 5 days, we will delve into the trend, momentum, volatility, and volume indicators to provide a comprehensive outlook on the possible stock price movement in the coming days. By examining these key factors, we aim to offer valuable insights and predictions for potential investors.
Trend Indicators:
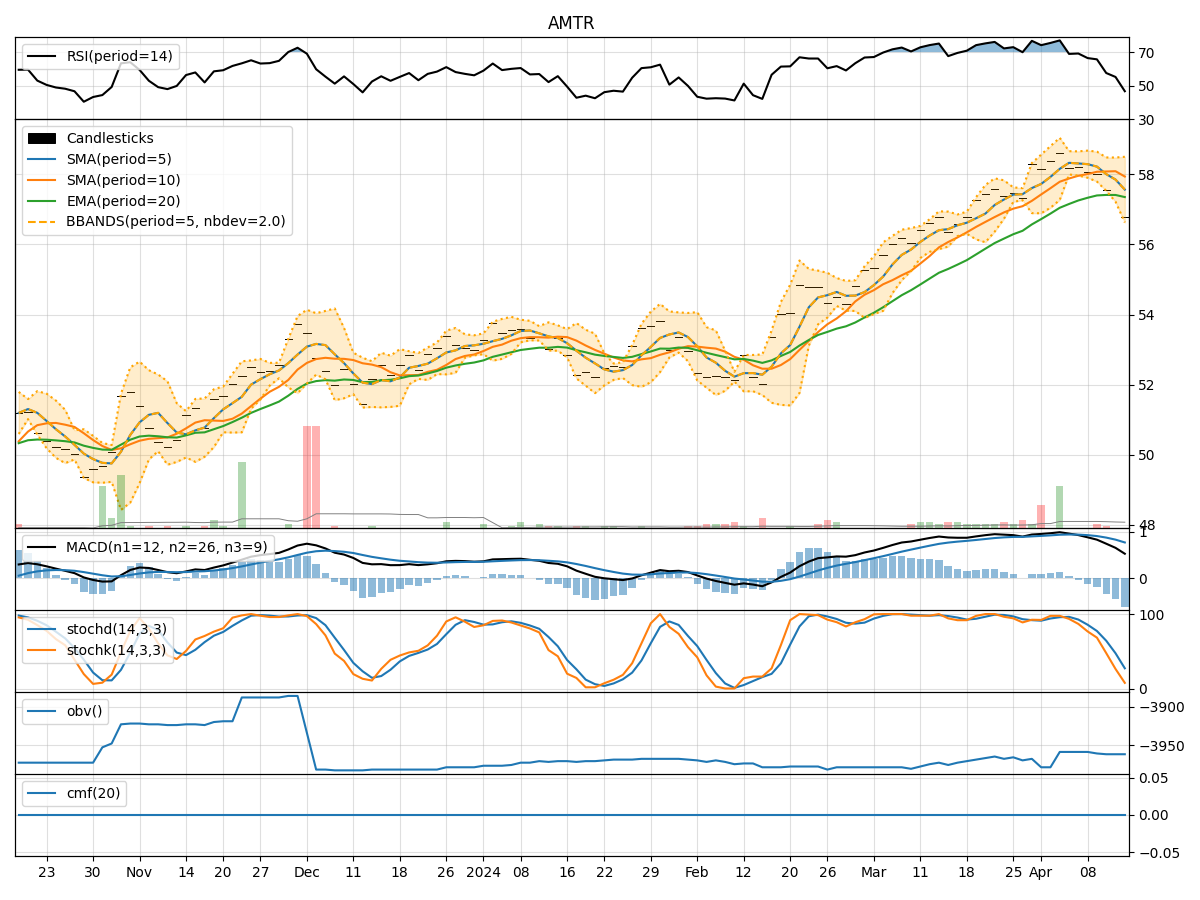
- Moving Averages (MA): The 5-day moving average has been consistently above the simple moving average (SMA) and exponential moving average (EMA), indicating a bullish trend.
- MACD: The MACD line has been consistently above the signal line, with both lines showing an upward trend, suggesting bullish momentum.
- Conclusion: The trend indicators point towards an upward movement in the stock price.
Momentum Indicators:
- RSI: The Relative Strength Index has been increasing and is currently in the overbought territory, indicating strong buying momentum.
- Stochastic Oscillator: Both %K and %D have been in the overbought zone, suggesting a strong bullish momentum.
- Conclusion: Momentum indicators signal a bullish sentiment in the market.
Volatility Indicators:
- Bollinger Bands: The stock price has been trading within the upper Bollinger Band, indicating high volatility.
- Conclusion: Volatility indicators suggest a volatile price movement in the near future.
Volume Indicators:
- On-Balance Volume (OBV): The OBV has been negative, indicating a net selling pressure in the market.
- Chaikin Money Flow (CMF): The CMF has been positive but relatively stable, suggesting a neutral volume flow.
- Conclusion: Volume indicators show a mixed sentiment with a slight bias towards selling pressure.
Conclusion:
Based on the analysis of the technical indicators, the overall outlook for AMTR in the next few days is bullish. The trend and momentum indicators strongly support a continued upward movement in the stock price. However, the high volatility and mixed volume signals indicate a degree of uncertainty in the market. Investors should closely monitor the price action and consider risk management strategies to capitalize on potential opportunities while being mindful of the market dynamics.
In summary, the next few days for AMTR are likely to see an upward price movement, driven by the bullish trend and momentum. Traders should exercise caution due to the high volatility and mixed volume signals, ensuring they have a well-defined trading plan in place.