Technical Analysis of AMZD 2024-05-10
Overview:
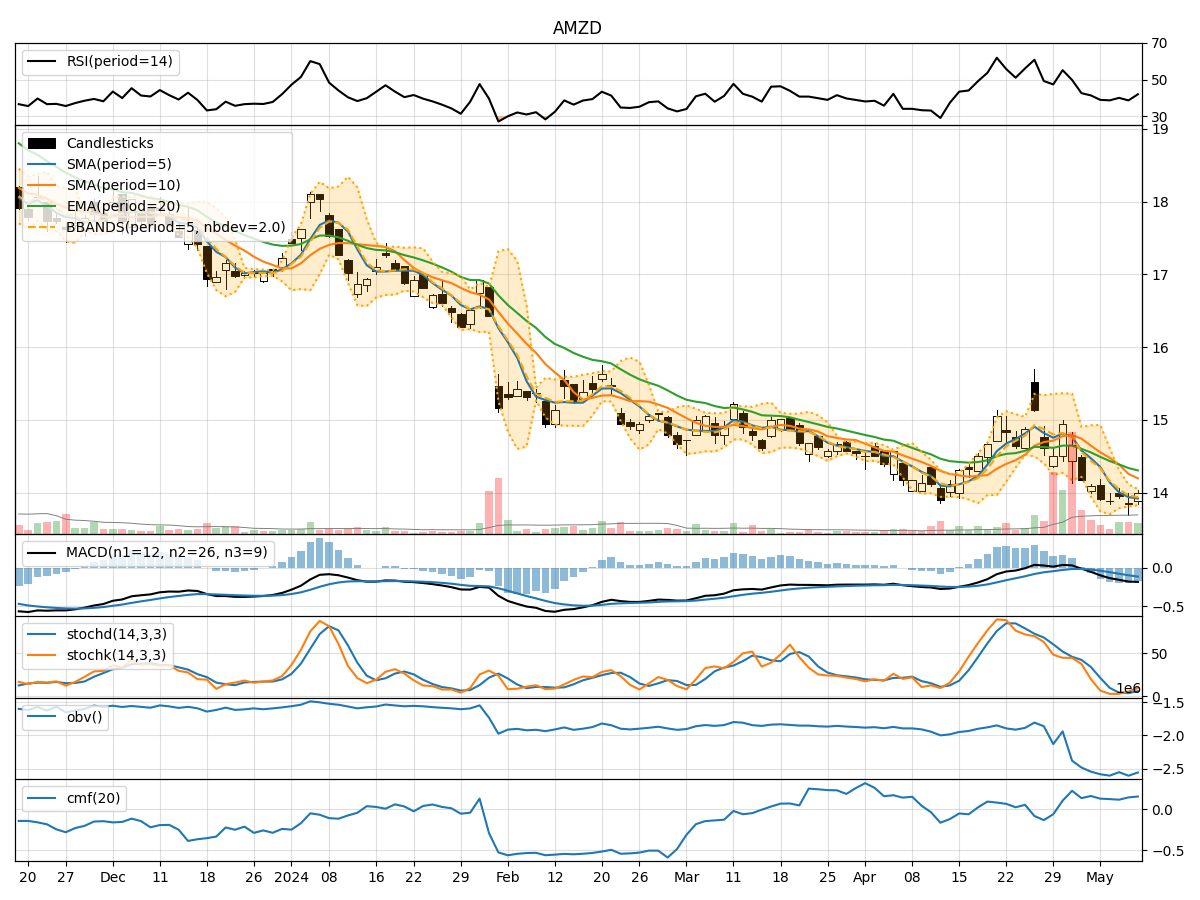
In analyzing the technical indicators for AMZD over the last 5 days, we will delve into the trends, momentum, volatility, and volume aspects to provide a comprehensive outlook on the possible stock price movement. By examining key indicators such as moving averages, MACD, RSI, Bollinger Bands, and OBV, we aim to offer valuable insights and predictions for the upcoming days.
Trend Analysis:
- Moving Averages (MA): The 5-day MA has been consistently below the closing price, indicating a short-term downtrend.
- MACD: The MACD line has been negative, with the MACD histogram showing a decreasing trend, signaling a bearish momentum.
Momentum Analysis:
- RSI: The RSI has been hovering around the oversold region, suggesting a potential reversal or continuation of the downtrend.
- Stochastic Oscillator: Both %K and %D have been relatively low, indicating a bearish momentum.
Volatility Analysis:
- Bollinger Bands (BB): The stock price has been trading below the middle Bollinger Band, indicating a bearish sentiment.
Volume Analysis:
- On-Balance Volume (OBV): The OBV has been consistently negative, reflecting selling pressure in the stock.
Key Observations:
- The stock is currently in a downtrend based on moving averages and MACD.
- Momentum indicators like RSI and Stochastic Oscillator suggest a bearish sentiment.
- Volatility indicators such as Bollinger Bands confirm the bearish outlook.
- The negative OBV indicates increased selling pressure in the stock.
Conclusion:
Based on the analysis of the technical indicators, the next few days are likely to see a continuation of the downward trend for AMZD. The momentum remains bearish, with no strong signals of a reversal in the near term. Therefore, it is advisable to exercise caution and consider potential shorting opportunities or staying on the sidelines until a clearer trend emerges.