Technical Analysis of AOR 2024-05-10
Overview:
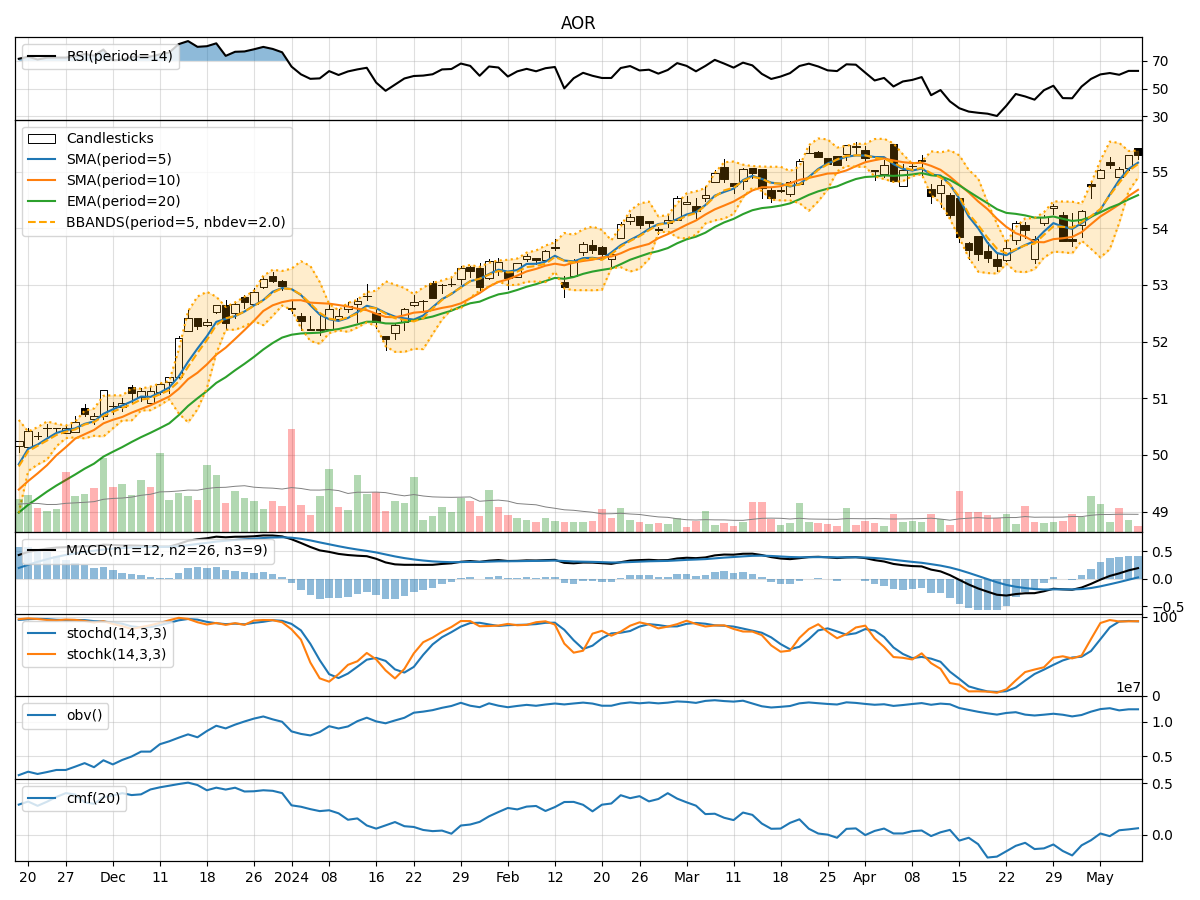
In analyzing the technical indicators for AOR stock over the last 5 days, we will delve into the trend, momentum, volatility, and volume indicators to provide a comprehensive outlook on the possible stock price movement in the coming days. By examining key metrics such as moving averages, MACD, RSI, Bollinger Bands, and OBV, we aim to offer valuable insights and predictions for potential price trends.
Trend Indicators:
- Moving Averages (MA): The 5-day MA has been consistently above the closing prices, indicating a bullish trend.
- MACD: The MACD line has been trending upwards, with the MACD histogram showing positive values, suggesting bullish momentum.
- EMA: The EMA has been steadily increasing, supporting the bullish sentiment in the short to medium term.
Momentum Indicators:
- RSI: The RSI has been in the overbought territory, suggesting a strong bullish momentum.
- Stochastic Oscillator: Both %K and %D have been in the overbought zone, indicating a potential reversal or consolidation.
- Williams %R: The indicator has been fluctuating around oversold levels, signaling potential buying opportunities.
Volatility Indicators:
- Bollinger Bands: The stock price has been trading within the bands, indicating normal volatility.
- Bollinger %B: The %B indicator has been hovering around the middle range, suggesting a balanced market sentiment.
Volume Indicators:
- On-Balance Volume (OBV): The OBV has shown mixed signals, with some days experiencing selling pressure and others showing accumulation.
- Chaikin Money Flow (CMF): The CMF has been positive, indicating buying pressure and potential bullish sentiment.
Key Observations:
- The trend indicators suggest a strong bullish sentiment in the short to medium term.
- Momentum indicators indicate a potential overbought condition, which could lead to a reversal or consolidation.
- Volatility remains relatively stable, with no significant spikes or drops in price.
- Volume indicators show mixed signals, with both buying and selling pressure evident in the market.
Conclusion:
Based on the analysis of the technical indicators, the stock is likely to experience a short-term consolidation or a minor pullback due to the overbought conditions highlighted by the momentum indicators. However, the overall trend remains bullish, supported by the moving averages and MACD. Traders should exercise caution and consider potential entry points during any dips in price. Long-term investors can continue to hold their positions based on the positive trend signals.