Technical Analysis of APCB 2024-05-10
Overview:
In analyzing the technical indicators for APCB over the last 5 days, we will delve into the trend, momentum, volatility, and volume indicators to provide a comprehensive outlook on the possible stock price movement. By examining these key aspects, we aim to offer valuable insights and predictions for the upcoming days.
Trend Analysis:
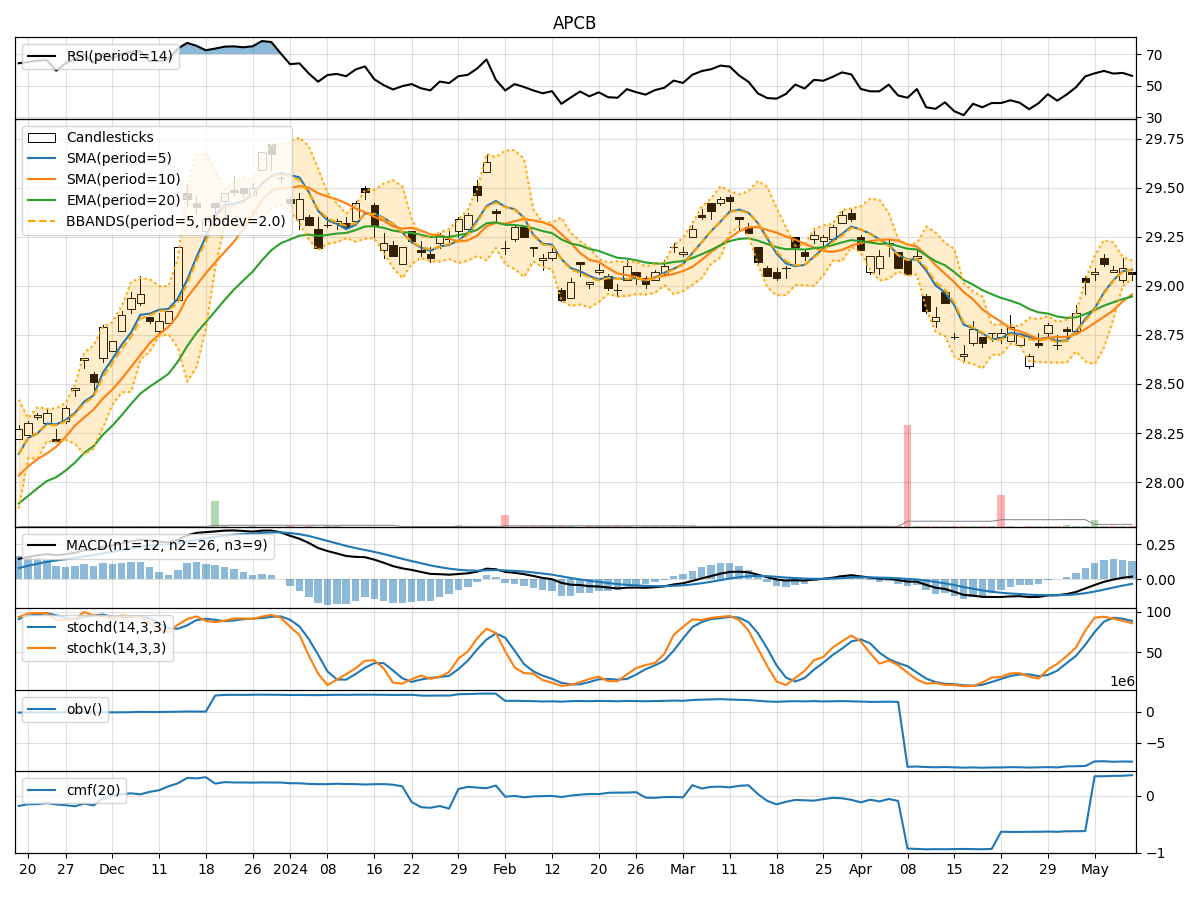
- Moving Averages (MA): The 5-day Moving Average (MA) has been consistently above the Simple Moving Average (SMA) and Exponential Moving Average (EMA), indicating a bullish trend.
- MACD: The MACD line has been consistently above the signal line, suggesting a positive momentum in the stock price.
- RSI: The Relative Strength Index (RSI) has been fluctuating around the 50 level, indicating a neutral stance in terms of momentum.
Momentum Analysis:
- Stochastic Oscillator: The Stochastic Oscillator has been gradually decreasing, indicating a potential reversal in momentum.
- Williams %R: The Williams %R is in the oversold territory, suggesting a possible buying opportunity.
Volatility Analysis:
- Bollinger Bands: The Bollinger Bands have been narrowing, indicating decreasing volatility in the stock price.
- Average True Range (ATR): The ATR has been relatively stable, suggesting consistent price movements.
Volume Analysis:
- On-Balance Volume (OBV): The OBV has been fluctuating, indicating mixed sentiment among investors.
- Chaikin Money Flow (CMF): The CMF has been gradually increasing, suggesting a potential inflow of money into the stock.
Key Observations:
- The trend indicators suggest a bullish sentiment in the short term.
- Momentum indicators show a potential reversal in momentum.
- Volatility indicators point towards decreasing volatility.
- Volume indicators indicate mixed sentiment among investors.
Conclusion:
Based on the analysis of the technical indicators, the next few days' possible stock price movement for APCB is likely to be bullish in the short term. However, caution is advised due to the potential reversal in momentum indicated by the Stochastic Oscillator. Traders should closely monitor the price action and key support/resistance levels to make informed decisions.