Technical Analysis of APMU 2024-05-10
Overview:
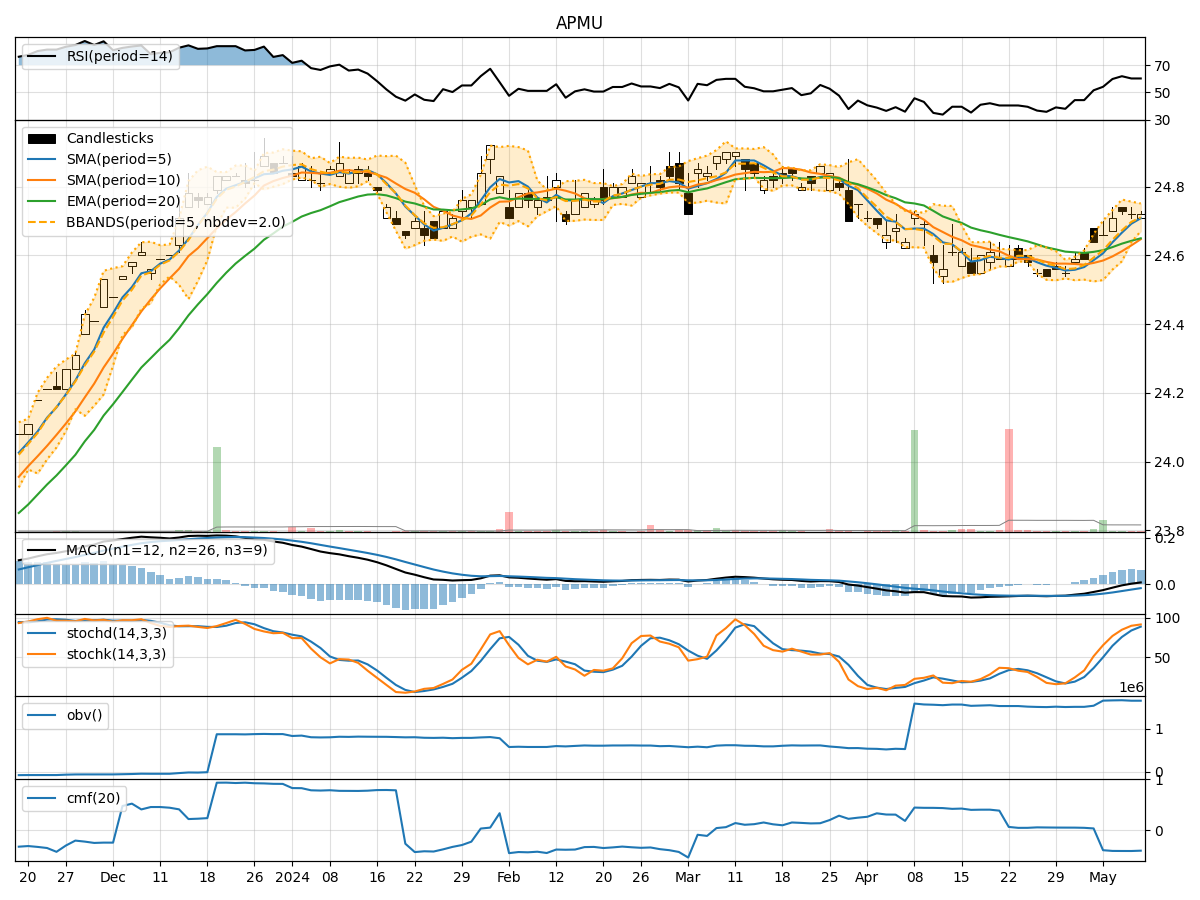
In analyzing the technical indicators for APMU stock over the last 5 days, we will delve into the trends, momentum, volatility, and volume aspects to provide a comprehensive outlook on the possible future stock price movement. By examining key indicators such as moving averages, MACD, RSI, Bollinger Bands, and OBV, we aim to offer valuable insights and predictions for the upcoming trading days.
Trend Analysis:
- Moving Averages (MA): The 5-day MA has been consistently above the closing price, indicating a short-term uptrend.
- MACD: The MACD line has been gradually increasing, with the MACD histogram moving towards the zero line, suggesting a potential bullish crossover.
- EMA: The EMA has been trending slightly upwards, reflecting positive momentum in the stock price.
Momentum Analysis:
- RSI: The RSI has been fluctuating around the neutral zone, indicating a balanced momentum without extreme overbought or oversold conditions.
- Stochastic Oscillator: Both %K and %D have been in the overbought territory, suggesting a potential reversal or consolidation phase.
- Williams %R: The Williams %R is hovering near the oversold region, signaling a possible buying opportunity.
Volatility Analysis:
- Bollinger Bands: The stock price has been trading within the Bollinger Bands, with the bands narrowing, indicating reduced volatility.
- Bollinger %B: The %B indicator is below 1, suggesting the stock is trading below the upper band, potentially indicating a pullback or consolidation phase.
Volume Analysis:
- On-Balance Volume (OBV): The OBV has been relatively stable, indicating a balance between buying and selling pressure.
- Chaikin Money Flow (CMF): The CMF has been negative, reflecting a lack of strong buying interest in the stock.
Conclusion:
Based on the analysis of the technical indicators, the stock of APMU is likely to experience sideways movement in the next few days. The trend indicators suggest a potential bullish crossover in the MACD, supported by the upward trend in the EMA. However, the momentum indicators show mixed signals with the RSI in a neutral zone and stochastic oscillators indicating potential reversals. The volatility indicators point towards reduced volatility and a possible consolidation phase. The volume indicators also reflect a lack of significant buying interest.
Therefore, considering all the factors, it is recommended to exercise caution and closely monitor the stock price for any signs of a clear trend direction before making any significant trading decisions.