Technical Analysis of APRH 2024-05-10
Overview:
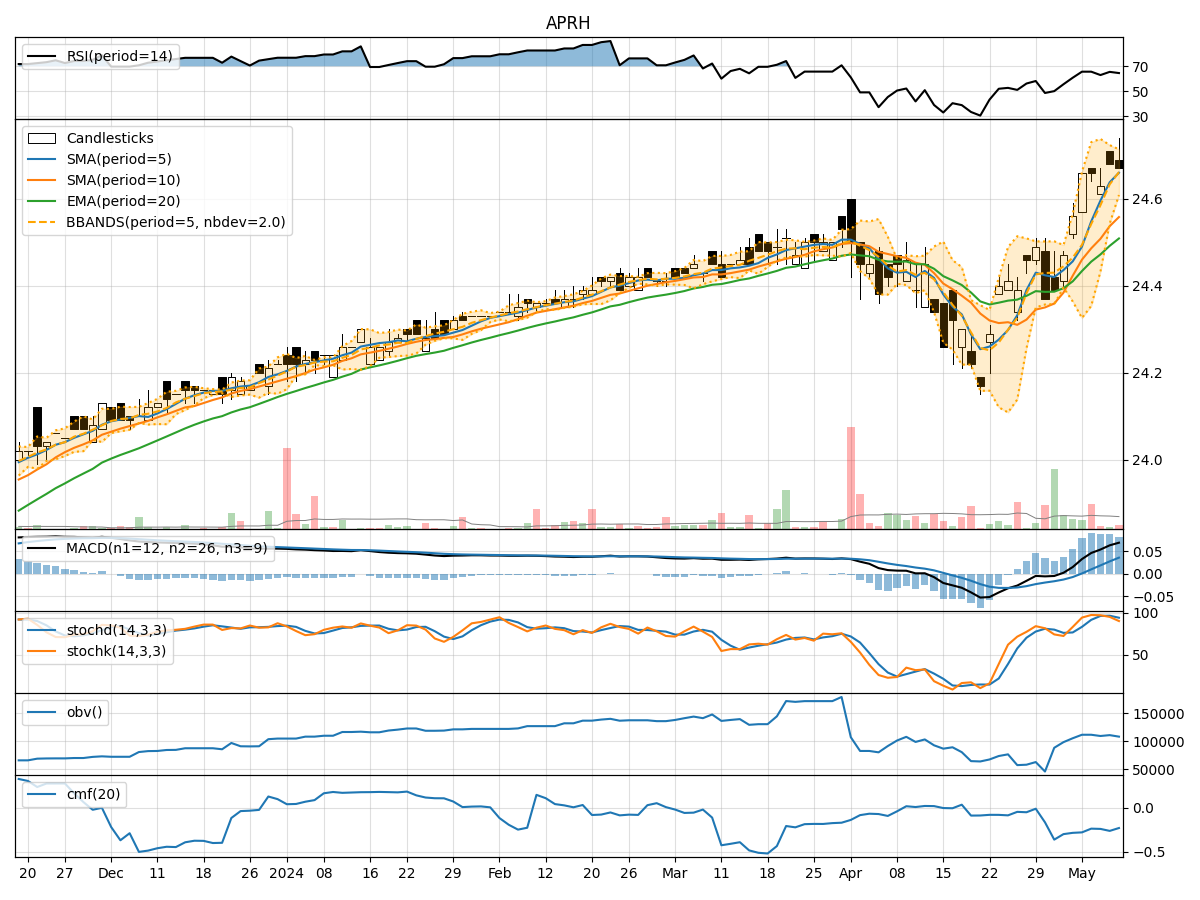
In analyzing the technical indicators for APRH over the last 5 days, we will delve into the trend, momentum, volatility, and volume indicators to provide a comprehensive outlook on the possible stock price movement in the coming days.
Trend Analysis:
- Moving Averages (MA): The 5-day Moving Average (MA) has been steadily increasing, indicating a positive trend in the stock price.
- MACD: The MACD line has been consistently above the signal line, suggesting bullish momentum.
- EMA: The Exponential Moving Average (EMA) has been on an upward trajectory, supporting the bullish trend.
Momentum Analysis:
- RSI: The Relative Strength Index (RSI) has been hovering around 65, indicating a neutral to slightly bullish momentum.
- Stochastic Oscillator: Both %K and %D have been relatively high, signaling overbought conditions.
- Williams %R: The Williams %R is in the oversold territory, suggesting a potential reversal.
Volatility Analysis:
- Bollinger Bands (BB): The stock price has been trading within the Bollinger Bands, with the bands narrowing, indicating decreasing volatility.
- BB %B: The %B indicator shows the stock price is currently trading close to the upper band, potentially signaling a near-term pullback.
Volume Analysis:
- On-Balance Volume (OBV): The OBV has been negative, indicating distribution rather than accumulation.
- Chaikin Money Flow (CMF): The CMF has been negative, reflecting selling pressure in the stock.
Key Observations:
- The trend indicators suggest a bullish sentiment in the stock price.
- Momentum indicators show conflicting signals with overbought conditions and potential for a reversal.
- Volatility indicators point towards decreasing volatility and a possible consolidation phase.
- Volume indicators indicate selling pressure and lack of strong buying interest.
Conclusion:
Based on the analysis of the technical indicators, the next few days' possible stock price movement for APRH is likely to experience a consolidation phase with a slight downward bias. The bullish trend may face resistance due to overbought conditions and selling pressure reflected in the volume indicators. Traders should exercise caution and consider potential pullbacks before entering new positions.