Technical Analysis of APRQ 2024-05-10
Overview:
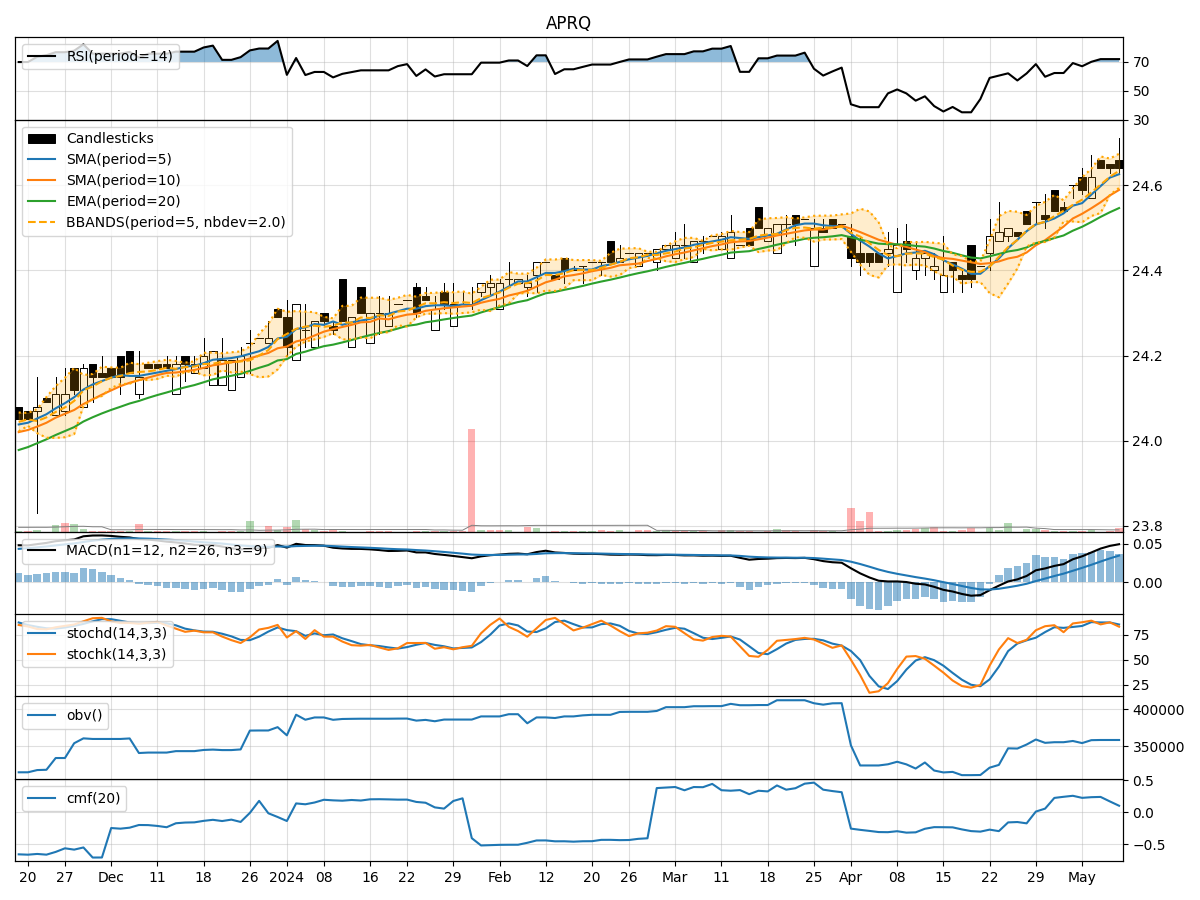
In the last 5 trading days, APRQ stock has shown a consistent uptrend in its price, supported by positive momentum and relatively stable volatility. Volume indicators also suggest a healthy accumulation of the stock. The Moving Average Convergence Divergence (MACD) indicator has been steadily increasing, indicating a strengthening bullish momentum. The Relative Strength Index (RSI) and Stochastic Oscillator suggest the stock is in overbought territory, but the price has continued to climb. The Bollinger Bands show the stock price is trading near the upper band, indicating potential overbought conditions.
Trend Indicators Analysis:
- Moving Averages (MA): The 5-day Moving Average has been consistently above the longer-term Simple Moving Average (SMA) and Exponential Moving Average (EMA), indicating a short-term bullish trend.
- MACD: The MACD line has been rising steadily above the signal line, indicating increasing bullish momentum.
- MACD Histogram: The MACD Histogram has been positive and expanding, further confirming the bullish momentum.
Momentum Indicators Analysis:
- RSI: The RSI has been in overbought territory, suggesting a potential reversal or consolidation in the near term.
- Stochastic Oscillator: Both %K and %D lines of the Stochastic Oscillator have been in overbought territory, indicating a potential pullback or consolidation.
- Williams %R: The Williams %R is also in oversold territory, signaling a potential reversal.
Volatility Indicators Analysis:
- Bollinger Bands: The stock price has been trading near the upper Bollinger Band, indicating potential overbought conditions.
- Bollinger Band Width: The Band Width has been relatively stable, suggesting consistent volatility.
- Bollinger Band %B: The %B indicator is above 0.8, indicating the stock is trading at the upper end of its recent price range.
Volume Indicators Analysis:
- On-Balance Volume (OBV): The OBV has been negative, suggesting some distribution of the stock.
- Chaikin Money Flow (CMF): The CMF has been positive, indicating buying pressure in the stock.
Key Observations:
- The stock has been in a strong uptrend, supported by bullish trend and momentum indicators.
- Overbought conditions are present in the RSI, Stochastic Oscillator, and Williams %R, suggesting a potential pullback or consolidation.
- Volatility has been relatively stable, but the stock is trading near overbought levels according to the Bollinger Bands.
- Volume indicators show mixed signals, with OBV indicating distribution and CMF showing accumulation.
Conclusion:
Based on the technical analysis of the trend, momentum, volatility, and volume indicators, the next few days' possible stock price movement for APRQ is likely to experience a short-term pullback or consolidation. The overbought conditions in the momentum indicators and the proximity to the upper Bollinger Band suggest that the stock may need to take a breather before potentially resuming its uptrend. Traders should be cautious of a possible correction in the near term.