Technical Analysis of APRW 2024-05-10
Overview:
In analyzing the technical indicators for APRW over the last 5 days, we will delve into the trend, momentum, volatility, and volume indicators to provide a comprehensive outlook on the possible stock price movement in the coming days. By examining these key aspects, we aim to offer valuable insights and predictions to guide investment decisions.
Trend Indicators:
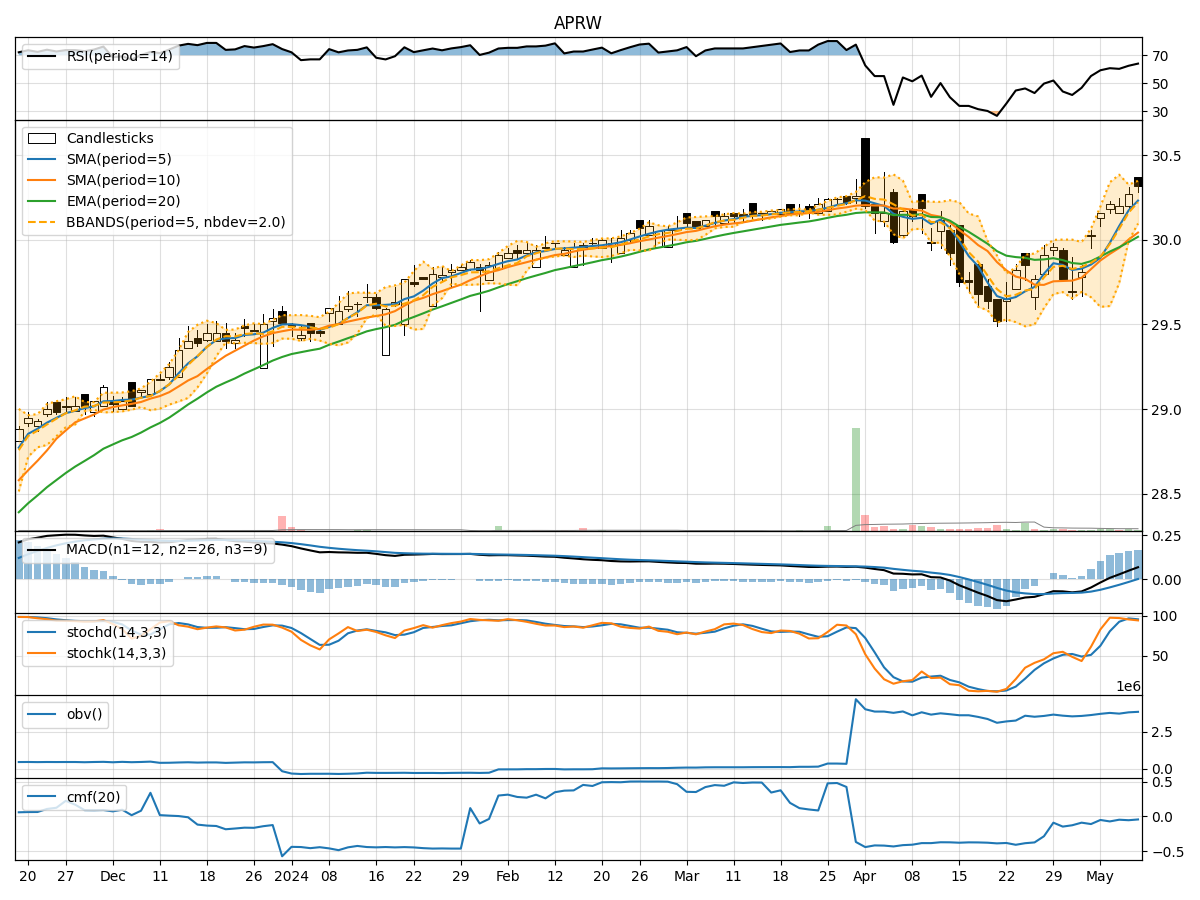
- Moving Averages (MA): The 5-day MA has been consistently above the 10-day SMA, indicating a short-term bullish trend. The EMA(20) has shown a gradual uptrend, suggesting positive momentum in the stock price.
- MACD: The MACD line has been above the signal line for the past 5 days, with the MACD histogram showing an increasing trend, signaling bullish momentum.
Momentum Indicators:
- RSI: The RSI has been trending upwards and is currently in the overbought territory, indicating a strong bullish momentum.
- Stochastic Oscillator: Both %K and %D lines of the stochastic oscillator have been in the overbought zone, suggesting a potential reversal or consolidation in the stock price.
- Williams %R: The Williams %R is in the oversold region, indicating a potential buying opportunity.
Volatility Indicators:
- Bollinger Bands (BB): The stock price has been trading within the upper Bollinger Band, indicating an overbought condition. However, the bands have not shown significant expansion, suggesting a possible consolidation phase.
- Bollinger %B: The %B indicator is above 0.8, indicating a high volatility period.
Volume Indicators:
- On-Balance Volume (OBV): The OBV has shown a slight increase over the last 5 days, suggesting accumulation by investors.
- Chaikin Money Flow (CMF): The CMF has been negative, indicating selling pressure in the stock.
Key Observations and Opinions:
- Trend: The stock is in a short-term bullish trend based on moving averages and MACD.
- Momentum: The RSI and stochastic oscillator suggest a strong bullish momentum, but the overbought conditions may lead to a potential reversal.
- Volatility: The Bollinger Bands indicate an overbought condition, while the %B suggests high volatility.
- Volume: The OBV shows accumulation, but the CMF indicates selling pressure.
Conclusion:
Based on the analysis of technical indicators, the stock price of APRW is likely to experience a short-term consolidation or pullback in the coming days. The overbought conditions in momentum indicators and high volatility levels suggest a potential reversal or sideways movement. Investors should exercise caution and consider waiting for a better entry point before initiating new positions.