Technical Analysis of APRZ 2024-05-10
Overview:
In analyzing the technical indicators for APRZ stock over the last 5 days, we will delve into the trend, momentum, volatility, and volume indicators to provide a comprehensive outlook on the possible stock price movement in the coming days. By examining these key indicators, we aim to offer valuable insights and predictions for informed decision-making.
Trend Analysis:
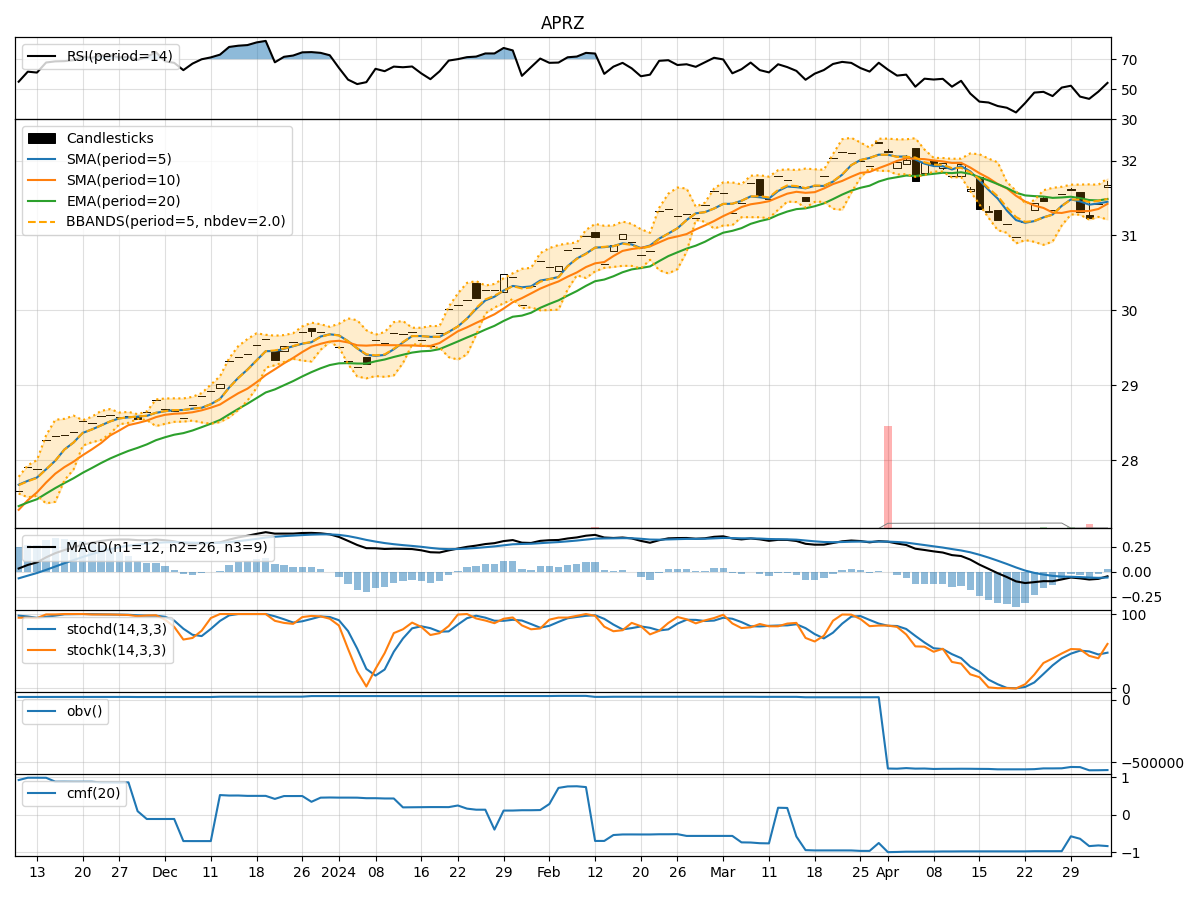
- Moving Averages (MA): The 5-day Moving Average has been consistently above the Simple Moving Average (SMA) and Exponential Moving Average (EMA), indicating a bullish trend.
- MACD: The MACD line has been consistently above the signal line, with both lines showing an upward trend, suggesting bullish momentum.
- RSI: The Relative Strength Index (RSI) has been gradually increasing, indicating strengthening bullish momentum.
Momentum Analysis:
- Stochastic Oscillator: Both %K and %D values have been consistently high, indicating strong upward momentum.
- Williams %R: The Williams %R indicator has been consistently in oversold territory, suggesting a potential reversal to the upside.
Volatility Analysis:
- Bollinger Bands: The stock price has been trading within the Bollinger Bands, with the bands narrowing, indicating decreasing volatility.
- Bollinger %B: The %B value has been increasing, suggesting a potential breakout or continuation of the current trend.
Volume Analysis:
- On-Balance Volume (OBV): The OBV has been relatively stable, indicating a balance between buying and selling pressure.
- Chaikin Money Flow (CMF): The CMF has been negative, indicating a slight outflow of money from the stock.
Key Observations:
- The trend indicators suggest a strong bullish sentiment, supported by the MACD and RSI.
- Momentum indicators indicate a continuation of the upward trend, with potential for a price reversal based on the Williams %R.
- Volatility indicators point towards decreasing volatility, potentially leading to a period of consolidation.
- Volume indicators show a balance between buying and selling pressure, with a slight outflow of money based on the CMF.
Conclusion:
Based on the analysis of the technical indicators, the next few days for APRZ stock are likely to see continued upward movement with a bullish bias. The strong trend and momentum signals, coupled with decreasing volatility, suggest a potential consolidation phase before a possible breakout to the upside. Traders and investors may consider buying opportunities on pullbacks or consolidation periods, while closely monitoring key support and resistance levels for potential entry and exit points.