Technical Analysis of ARB 2024-05-10
Overview:
In analyzing the technical indicators for ARB stock over the last 5 days, we will delve into the trend, momentum, volatility, and volume indicators to provide a comprehensive outlook on the possible stock price movement in the coming days. By examining these key indicators, we aim to offer valuable insights and predictions to guide investment decisions.
Trend Analysis:
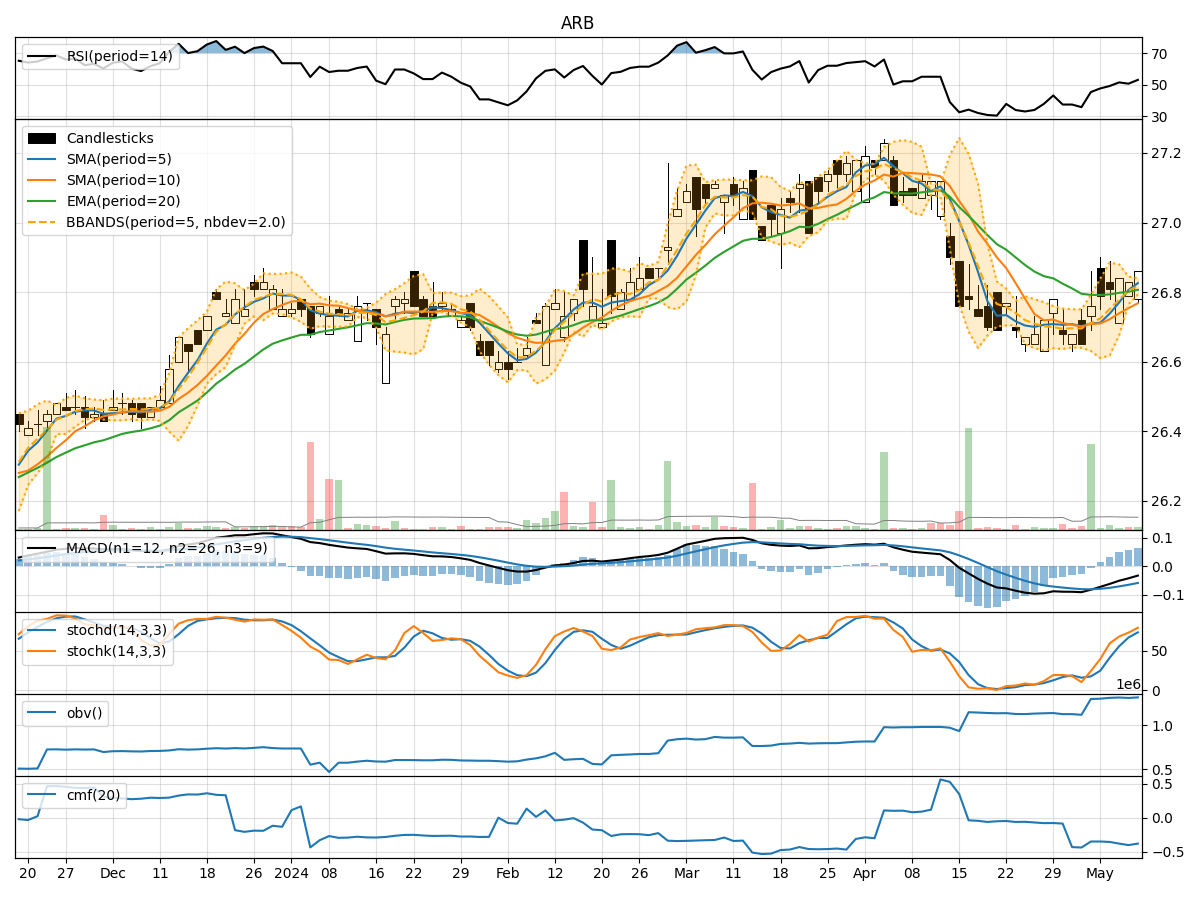
- Moving Averages (MA): The 5-day Moving Average (MA) has been showing a slight uptrend, indicating a positive momentum in the short term.
- MACD: The Moving Average Convergence Divergence (MACD) has been consistently negative but showing signs of convergence towards the signal line, suggesting a potential reversal in the near future.
Momentum Analysis:
- RSI: The Relative Strength Index (RSI) has been hovering around the neutral zone, indicating a balanced momentum between buying and selling pressure.
- Stochastic Oscillator: Both %K and %D of the Stochastic Oscillator have been in the overbought territory, signaling a potential reversal or consolidation phase.
Volatility Analysis:
- Bollinger Bands (BB): The Bollinger Bands have been narrowing, indicating decreasing volatility and a possible period of consolidation.
- Bollinger Band %B: The %B indicator has been fluctuating within a tight range, reflecting the consolidation phase in the stock price.
Volume Analysis:
- On-Balance Volume (OBV): The OBV indicator has been relatively stable, suggesting a balance between buying and selling volume.
- Chaikin Money Flow (CMF): The CMF has been negative, indicating a slight outflow of money from the stock.
Key Observations and Opinions:
- Trend: The stock is currently in an upward trend based on the moving averages, but the MACD signals a potential reversal or consolidation.
- Momentum: The momentum indicators suggest a neutral stance with a possibility of a reversal due to overbought conditions in the Stochastic Oscillator.
- Volatility: Volatility is decreasing, indicating a potential period of consolidation or a narrowing price range.
- Volume: The volume indicators show a balanced volume with a slight outflow of money based on the CMF.
Conclusion:
Based on the analysis of the technical indicators, the next few days for ARB stock are likely to see a sideways movement or consolidation. The stock may trade within a narrow range as it digests the recent uptrend and potential reversal signals from the MACD and Stochastic Oscillator. Traders should exercise caution and wait for clearer signals before making significant trading decisions.