Technical Analysis of ARCM 2024-05-10
Overview:
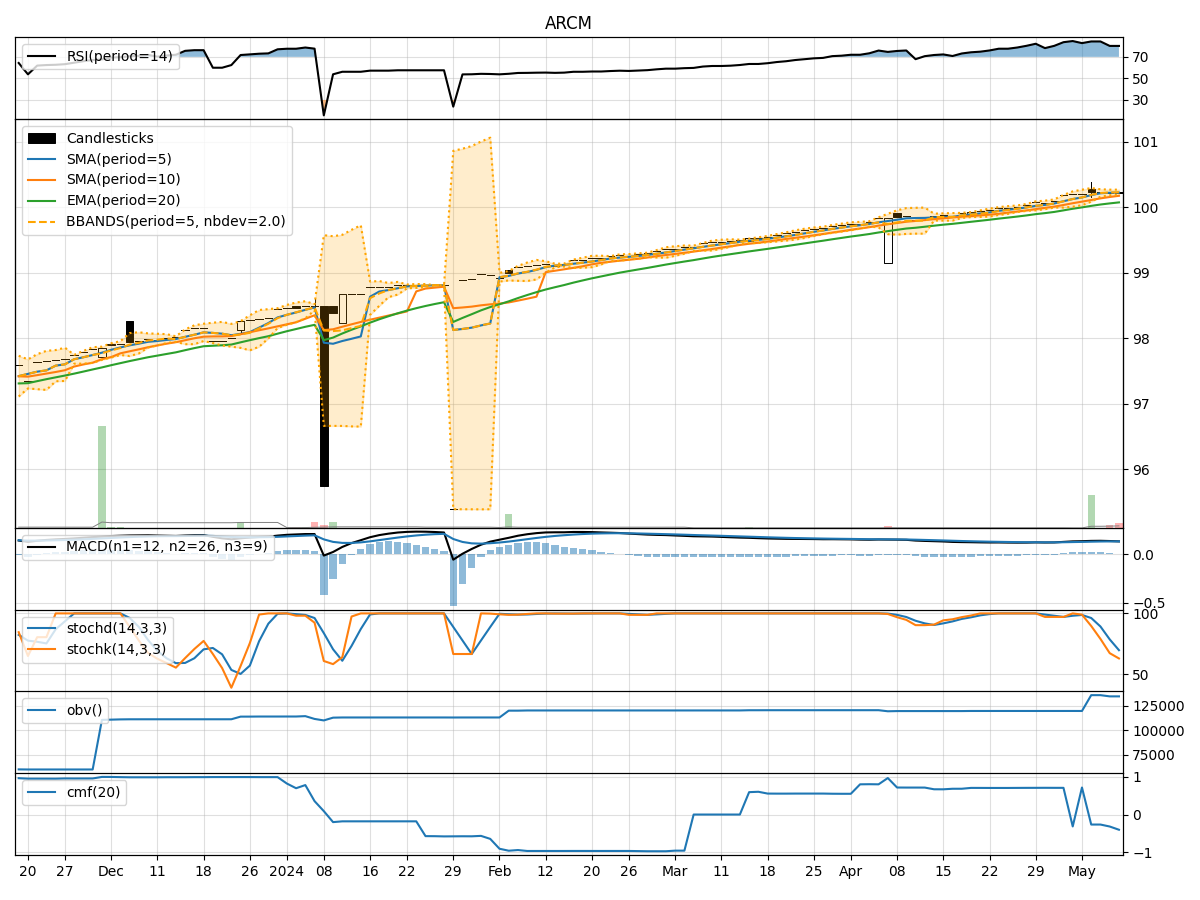
In analyzing the technical indicators for ARCM over the last 5 days, we will delve into the trend, momentum, volatility, and volume indicators to provide a comprehensive outlook on the possible stock price movement in the coming days.
Trend Analysis:
- Moving Averages (MA): The 5-day MA has been consistently above the closing price, indicating a short-term uptrend.
- MACD: The MACD line has been above the signal line, suggesting a bullish momentum.
- EMA: The EMA has been steadily increasing, supporting the bullish trend.
Momentum Analysis:
- RSI: The RSI has been in the overbought territory, indicating a strong bullish momentum.
- Stochastic Oscillator: Both %K and %D have been declining, signaling a potential reversal from overbought levels.
- Williams %R: The indicator has been in oversold territory, suggesting a possible reversal to the upside.
Volatility Analysis:
- Bollinger Bands: The stock price has been trading within the bands, indicating a period of consolidation.
- Bollinger %B: The %B indicator has been fluctuating around the midline, reflecting a lack of clear trend direction.
Volume Analysis:
- On-Balance Volume (OBV): The OBV has shown mixed signals with fluctuations, indicating indecision among market participants.
- Chaikin Money Flow (CMF): The CMF has been negative, suggesting selling pressure in the stock.
Key Observations:
- The trend indicators point towards a bullish sentiment in the short term.
- Momentum indicators show a potential shift in momentum from overbought levels.
- Volatility indicators suggest a period of consolidation with no clear trend direction.
- Volume indicators reflect mixed signals with no strong conviction from market participants.
Conclusion:
Based on the analysis of the technical indicators, the stock of ARCM is likely to experience sideways movement in the coming days. The bullish trend may face some resistance due to overbought conditions and a potential reversal in momentum. The consolidation phase indicated by volatility indicators aligns with the indecision among market participants reflected in volume indicators. Therefore, it is recommended to exercise caution and closely monitor the stock for any signs of a breakout or trend reversal before making any trading decisions.