Technical Analysis of ARKC 2024-05-10
Overview:
In analyzing the technical indicators for ARKC over the last 5 days, we will delve into the trend, momentum, volatility, and volume indicators to provide a comprehensive outlook on the possible stock price movement. By examining these key aspects, we aim to offer valuable insights and predictions for the upcoming days.
Trend Analysis:
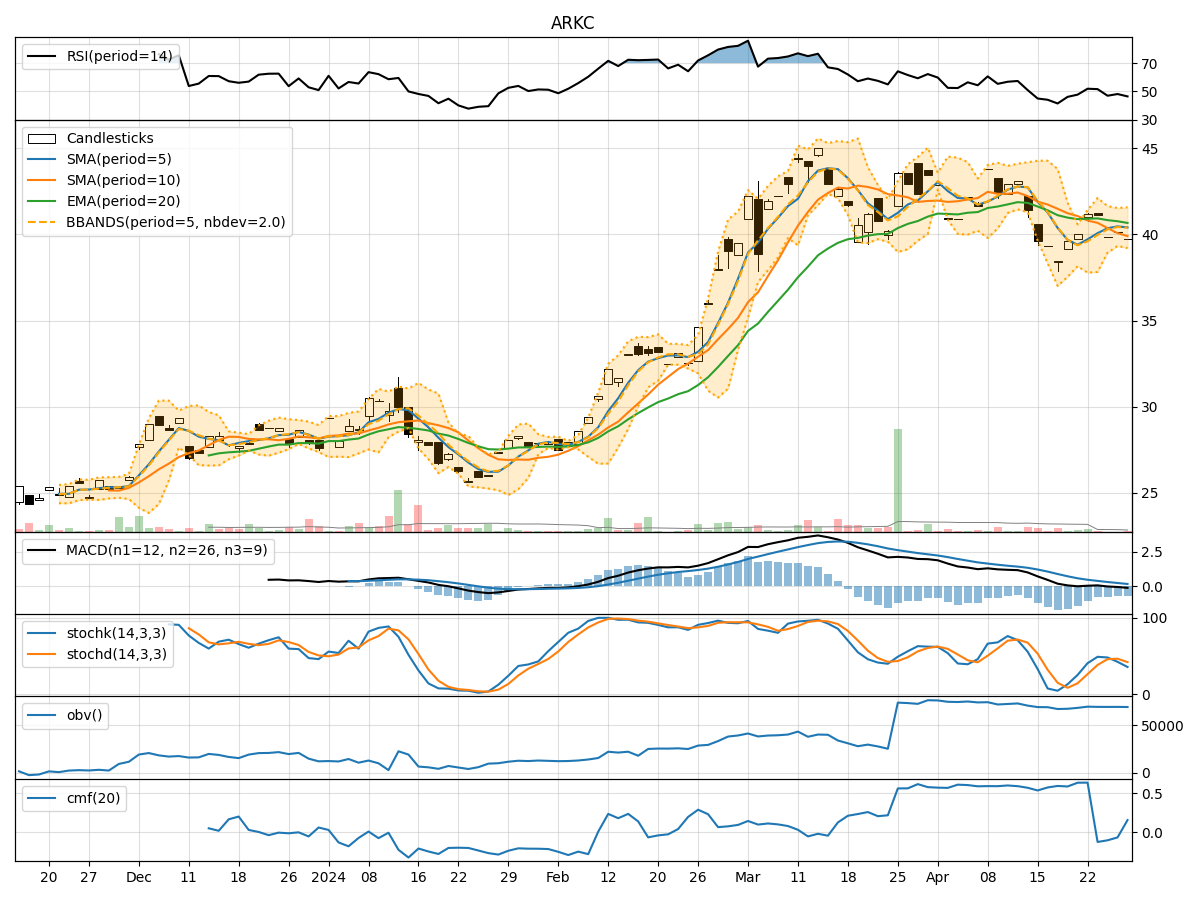
- Moving Averages (MA): The 5-day Moving Average (MA) has been fluctuating around the Simple Moving Average (SMA) and Exponential Moving Average (EMA) values, indicating a lack of clear trend direction.
- MACD: The Moving Average Convergence Divergence (MACD) has been negative, with the MACD line consistently below the signal line, suggesting a bearish momentum.
- Conclusion: The trend indicators point towards a bearish sentiment in the short term.
Momentum Analysis:
- RSI: The Relative Strength Index (RSI) has been hovering around the mid-level, indicating a neutral momentum.
- Stochastic Oscillator: Both %K and %D values have been fluctuating, showing indecision in momentum.
- Conclusion: The momentum indicators suggest a sideways movement with no clear direction.
Volatility Analysis:
- Bollinger Bands: The stock price has been trading within the Bollinger Bands, with the bands narrowing, indicating decreasing volatility.
- Conclusion: Volatility indicators signal a consolidation phase with a potential decrease in price fluctuations.
Volume Analysis:
- On-Balance Volume (OBV): The OBV has been relatively stable, showing no significant accumulation or distribution.
- Chaikin Money Flow (CMF): The CMF has been negative, indicating a slight outflow of money from the stock.
- Conclusion: Volume indicators suggest a neutral stance with no clear accumulation or distribution pattern.
Overall Conclusion:
Based on the analysis of trend, momentum, volatility, and volume indicators, the next few days for ARKC are likely to see a sideways movement with a bearish bias in the short term. The lack of clear trend direction, coupled with neutral momentum and volume, indicates a period of consolidation with a potential downside risk.
Recommendation:
- Short-term Traders: Consider staying on the sidelines or adopting a cautious approach due to the lack of clear trend direction.
- Long-term Investors: Monitor the stock closely for any signs of a reversal or a clear trend formation before making any significant investment decisions.
Disclaimer:
It is essential to remember that technical analysis is not a guaranteed predictor of future price movements, and other fundamental factors can influence stock prices. It is advisable to conduct thorough research and consider multiple indicators before making any investment decisions. Consulting with a financial advisor can provide personalized insights tailored to your investment goals and risk tolerance level.