Technical Analysis of ARKG 2024-05-10
Overview:
In analyzing the technical indicators for ARKG over the last 5 days, we will delve into the trend, momentum, volatility, and volume indicators to provide a comprehensive outlook on the possible stock price movement in the coming days. By examining these key aspects, we aim to offer valuable insights and predictions for potential investors.
Trend Analysis:
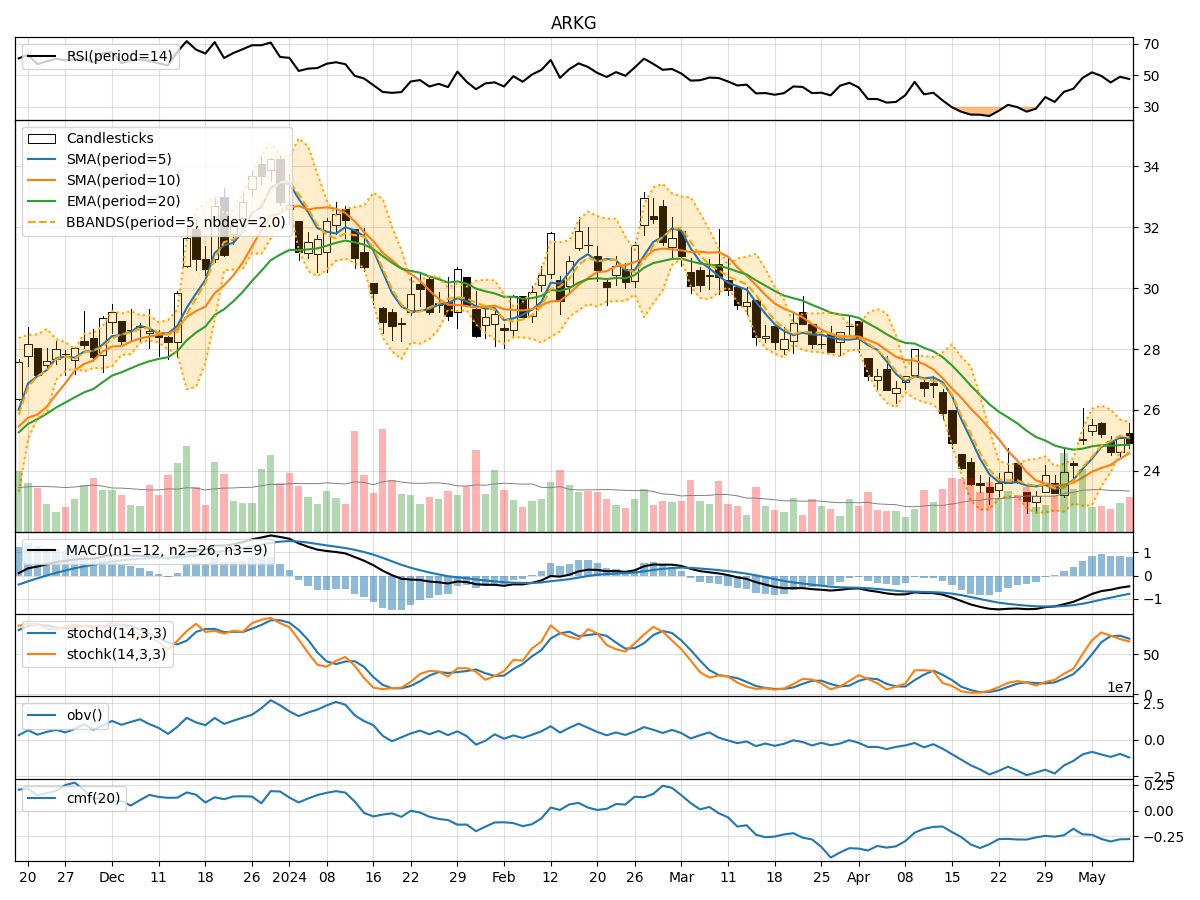
- Moving Averages (MA): The 5-day Moving Average (MA) has been consistently above the closing prices, indicating a short-term uptrend.
- MACD: The Moving Average Convergence Divergence (MACD) has shown negative values but with a slight convergence, suggesting a potential reversal in the downtrend.
- EMA: The Exponential Moving Average (EMA) has been relatively stable, reflecting a neutral trend.
Momentum Analysis:
- RSI: The Relative Strength Index (RSI) has fluctuated around the 50 level, indicating a balanced momentum without a clear trend.
- Stochastic Oscillator: Both %K and %D have been in the neutral zone, suggesting a lack of strong momentum direction.
- Williams %R: The Williams %R has shown oversold conditions but without a clear signal for a reversal.
Volatility Analysis:
- Bollinger Bands (BB): The Bollinger Bands have narrowed, indicating decreasing volatility and a potential consolidation phase.
- BB% (Bollinger Band %B): The %B indicator has been hovering around the midline, reflecting a balanced volatility level.
Volume Analysis:
- On-Balance Volume (OBV): The OBV has shown a consistent decline, indicating selling pressure and potential bearish sentiment.
- Chaikin Money Flow (CMF): The CMF has been negative, suggesting outflow of money from the stock.
Conclusion:
Based on the analysis of the technical indicators, the stock price of ARKG is likely to experience sideways movement in the coming days. The trend indicators show a potential reversal in the short-term downtrend, supported by the convergence in MACD. However, the lack of strong momentum direction and the negative volume indicators signal a cautious outlook. The narrowing Bollinger Bands and negative OBV further support the expectation of consolidation.
Recommendation:
Considering the mixed signals from the technical indicators, it is advisable for investors to exercise caution and closely monitor the price action of ARKG. It may be prudent to wait for clearer signals of a sustained trend before making significant trading decisions. Additionally, keeping an eye on key support and resistance levels can help in identifying potential entry or exit points.
In conclusion, while the technical analysis points towards a sideways movement, it is essential to remain vigilant and adapt to changing market conditions to make informed investment choices.