Technical Analysis of ARP 2024-05-10
Overview:
In analyzing the technical indicators for ARP stock over the last 5 days, we will delve into the trends, momentum, volatility, and volume indicators to provide a comprehensive outlook on the possible stock price movement in the coming days. By examining key metrics such as moving averages, MACD, RSI, Bollinger Bands, and OBV, we aim to offer valuable insights and predictions for potential price action.
Trend Indicators:
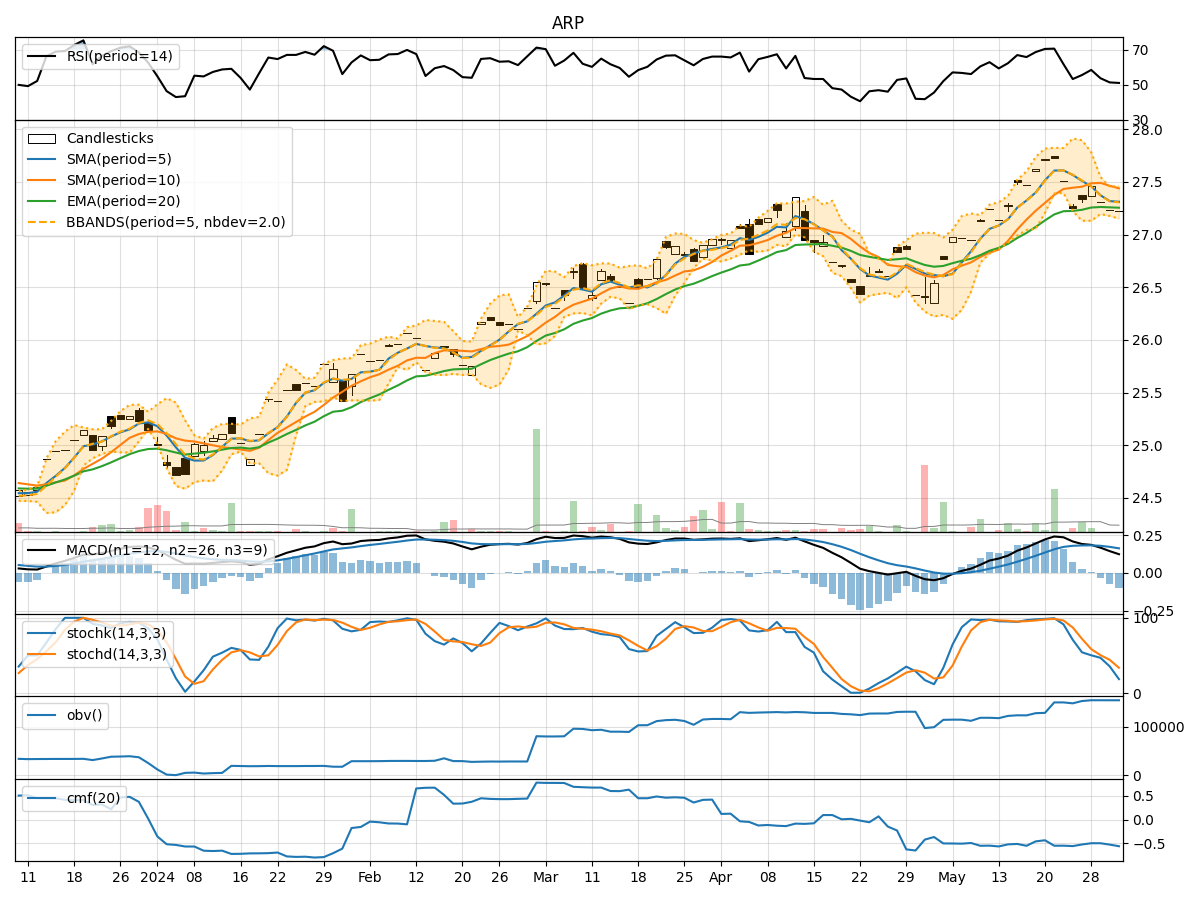
- Moving Averages (MA): The 5-day moving average has been consistently above the longer-term SMAs, indicating a short-term uptrend.
- MACD: The MACD line has been trending upwards, with the MACD histogram showing positive values, suggesting bullish momentum.
- EMA: The EMA has been steadily increasing, reflecting a positive trend in the stock price.
Momentum Indicators:
- RSI: The RSI has been in the overbought territory, indicating strong buying momentum.
- Stochastic Oscillator: Both %K and %D have been in the overbought zone, signaling potential for a pullback.
- Williams %R: The Williams %R has been hovering near the oversold region, suggesting a possible reversal.
Volatility Indicators:
- Bollinger Bands: The stock price has been trading within the upper Bollinger Band, indicating an overbought condition.
- Bollinger Band Width: The Band Width has been narrowing, suggesting a potential decrease in volatility.
- Bollinger Band %B: The %B indicator has been above 0.8, indicating a high price relative to the bands.
Volume Indicators:
- On-Balance Volume (OBV): The OBV has been fluctuating, indicating mixed buying and selling pressure.
- Chaikin Money Flow (CMF): The CMF has been negative, suggesting distribution in the stock.
Key Observations:
- The stock has shown strong bullish momentum based on RSI and Stochastic indicators.
- The Bollinger Bands suggest the stock is overbought and may see a potential pullback.
- Volume indicators show mixed signals, with OBV fluctuating and CMF indicating distribution.
Conclusion:
Based on the technical analysis of trend, momentum, volatility, and volume indicators, the stock is likely to experience a short-term pullback or consolidation after the recent bullish run. Traders should exercise caution and consider taking profits or waiting for a better entry point. The overbought conditions and mixed volume signals suggest a potential reversal in the stock price. It is advisable to monitor the price action closely for signs of a trend reversal before making any trading decisions.