Technical Analysis of ASEA 2024-05-10
Overview:
In analyzing the technical indicators for ASEA over the last 5 days, we will delve into the trend, momentum, volatility, and volume indicators to provide a comprehensive outlook on the possible stock price movement in the coming days. By examining these key aspects, we aim to offer valuable insights and predictions for potential investors.
Trend Analysis:
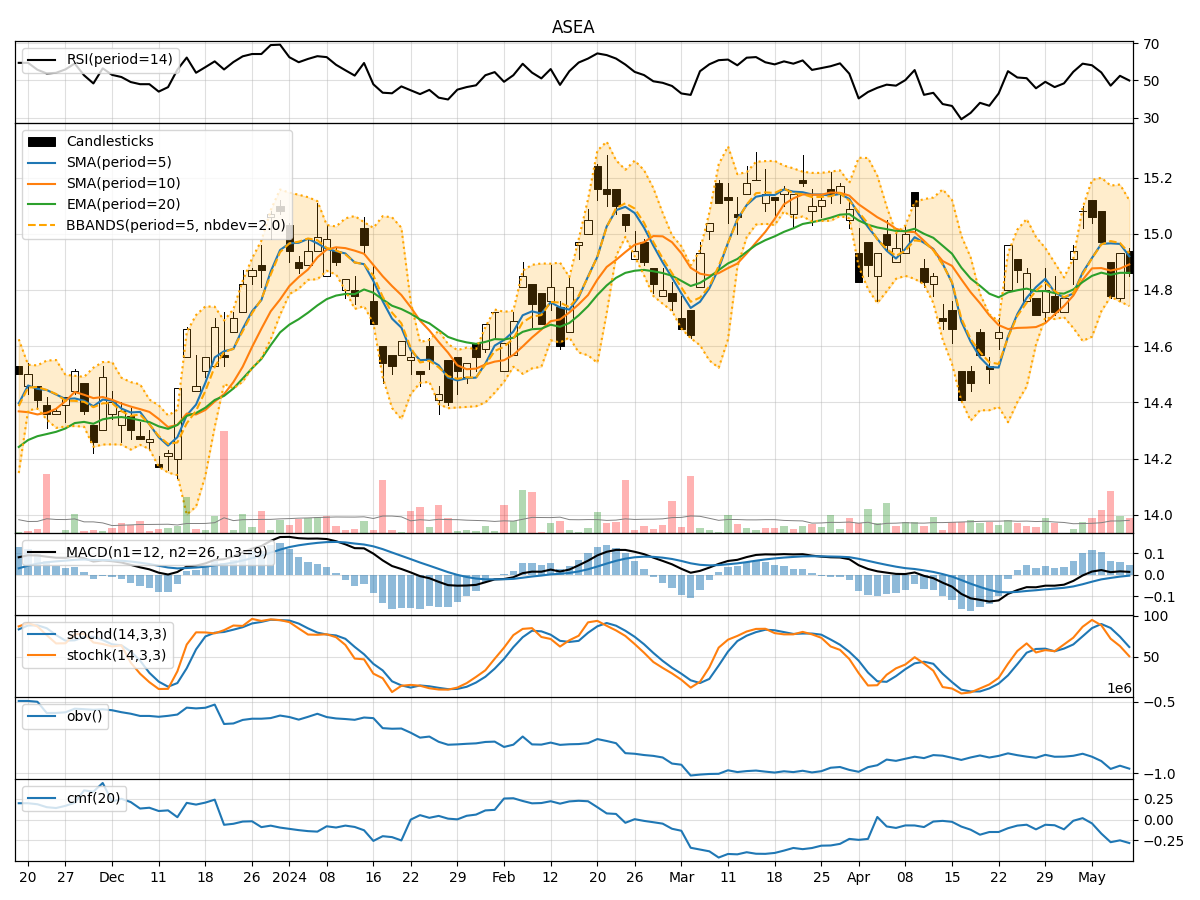
- Moving Averages (MA): The 5-day Moving Average (MA) has been fluctuating around the closing prices, indicating short-term price trends. The Simple Moving Average (SMA) and Exponential Moving Average (EMA) show a slight convergence, suggesting a potential trend reversal.
- Moving Average Convergence Divergence (MACD): The MACD and Signal Line (MACDh) have been hovering around zero, indicating a balanced market sentiment with no clear trend direction.
Momentum Analysis:
- Relative Strength Index (RSI): The RSI has been oscillating around the 50 level, reflecting a neutral momentum in the stock price.
- Stochastic Oscillator: Both %K and %D lines of the Stochastic Oscillator are in the oversold region, suggesting a potential buying opportunity.
- Williams %R (Willams %R): The Williams %R is in the oversold territory, indicating a possible reversal in the stock price.
Volatility Analysis:
- Bollinger Bands (BB): The Bollinger Bands are narrowing, indicating decreasing volatility and a potential price breakout in the near future.
Volume Analysis:
- On-Balance Volume (OBV): The OBV has been declining, suggesting a distribution phase where selling pressure is increasing.
- Chaikin Money Flow (CMF): The CMF is negative, indicating that money is flowing out of the stock.
Key Observations:
- The trend indicators show a potential trend reversal as moving averages converge.
- Momentum indicators suggest a neutral to slightly bullish sentiment.
- Volatility is decreasing, indicating a possible consolidation phase.
- Volume indicators point towards increasing selling pressure.
Conclusion:
Based on the analysis of the technical indicators, the next few days' possible stock price movement for ASEA is likely to be sideways with a slight bearish bias. Investors should exercise caution and closely monitor the price action for any potential breakout or trend reversal signals. It is advisable to wait for more confirmation from the indicators before making any significant trading decisions.