Technical Analysis of ASET 2024-05-10
Overview:
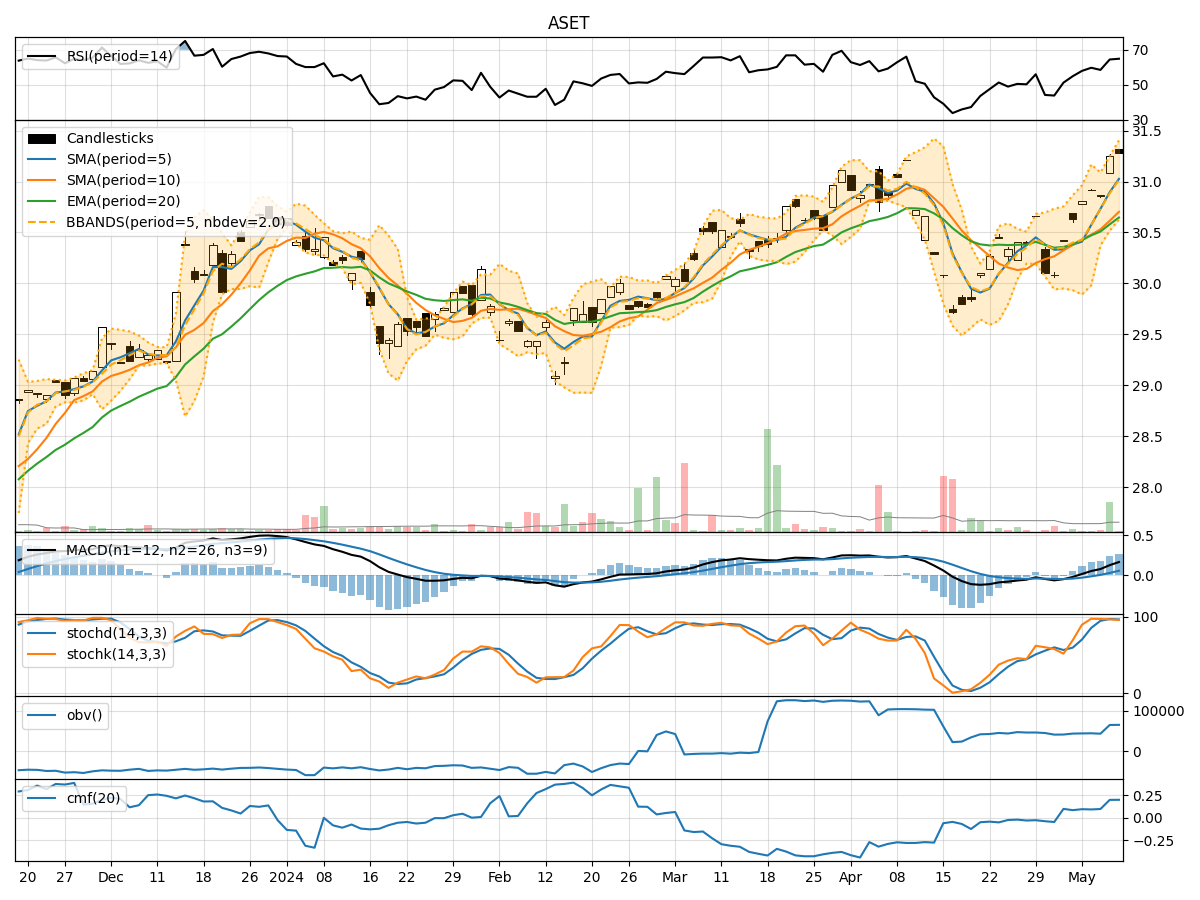
In the last 5 trading days, the stock has shown a consistent uptrend in both price and volume. The moving averages have been trending upwards, indicating a positive momentum. The MACD and RSI are also showing bullish signals. Volatility has been relatively stable, and volume has been increasing, suggesting growing interest in the stock.
Trend Analysis:
- Moving Averages (MA): The 5-day MA has been consistently above the 10-day SMA, indicating a short-term bullish trend. The EMA(20) is also trending upwards, supporting the bullish sentiment.
- MACD: The MACD line has been above the signal line for the past 5 days, with the MACD histogram showing an increasing positive trend. This suggests strong bullish momentum.
Momentum Analysis:
- RSI: The RSI has been consistently above 50, indicating bullish momentum. The RSI(14) has been increasing, showing strength in the current uptrend.
- Stochastic Oscillator: Both %K and %D lines are in the overbought zone, suggesting a strong bullish momentum.
Volatility Analysis:
- Bollinger Bands (BB): The stock price has been trading within the upper Bollinger Band, indicating an overbought condition. However, the bands have not widened significantly, suggesting stable volatility.
Volume Analysis:
- On-Balance Volume (OBV): The OBV has been steadily increasing over the past 5 days, indicating strong buying pressure.
- Chaikin Money Flow (CMF): The CMF(20) has been positive, indicating that money is flowing into the stock.
Key Observations:
- The stock is in a strong uptrend based on moving averages, MACD, and RSI.
- Momentum indicators like Stochastic Oscillator also confirm the bullish sentiment.
- Volatility is stable, and volume is increasing, supporting the uptrend.
Conclusion:
Based on the technical indicators and analysis: - The stock is in a strong upward trend with bullish momentum and positive volume flow. - The next few days are likely to see continued upward movement in the stock price. - Consider buying opportunities as the stock shows strength and positive momentum. - Monitor for potential overbought conditions as indicated by the upper Bollinger Band.
Final Recommendation:
- Bullish View: The stock is poised for further upside potential. Consider holding or adding to positions.
- Upside Potential: Look for price targets based on resistance levels and monitor for any signs of reversal.
- Risk Management: Set stop-loss levels to protect profits in case of a sudden downturn.
In summary, the technical analysis suggests a strong bullish outlook for the stock in the next few days. It is essential to monitor the indicators closely for any signs of reversal or overbought conditions.