Technical Analysis of ASHS 2024-05-10
Overview:
In analyzing the technical indicators for ASHS over the last 5 days, we will delve into the trend, momentum, volatility, and volume indicators to provide a comprehensive assessment of the stock's potential price movement. By examining these key factors, we aim to offer valuable insights and predictions for the next few days.
Trend Indicators:
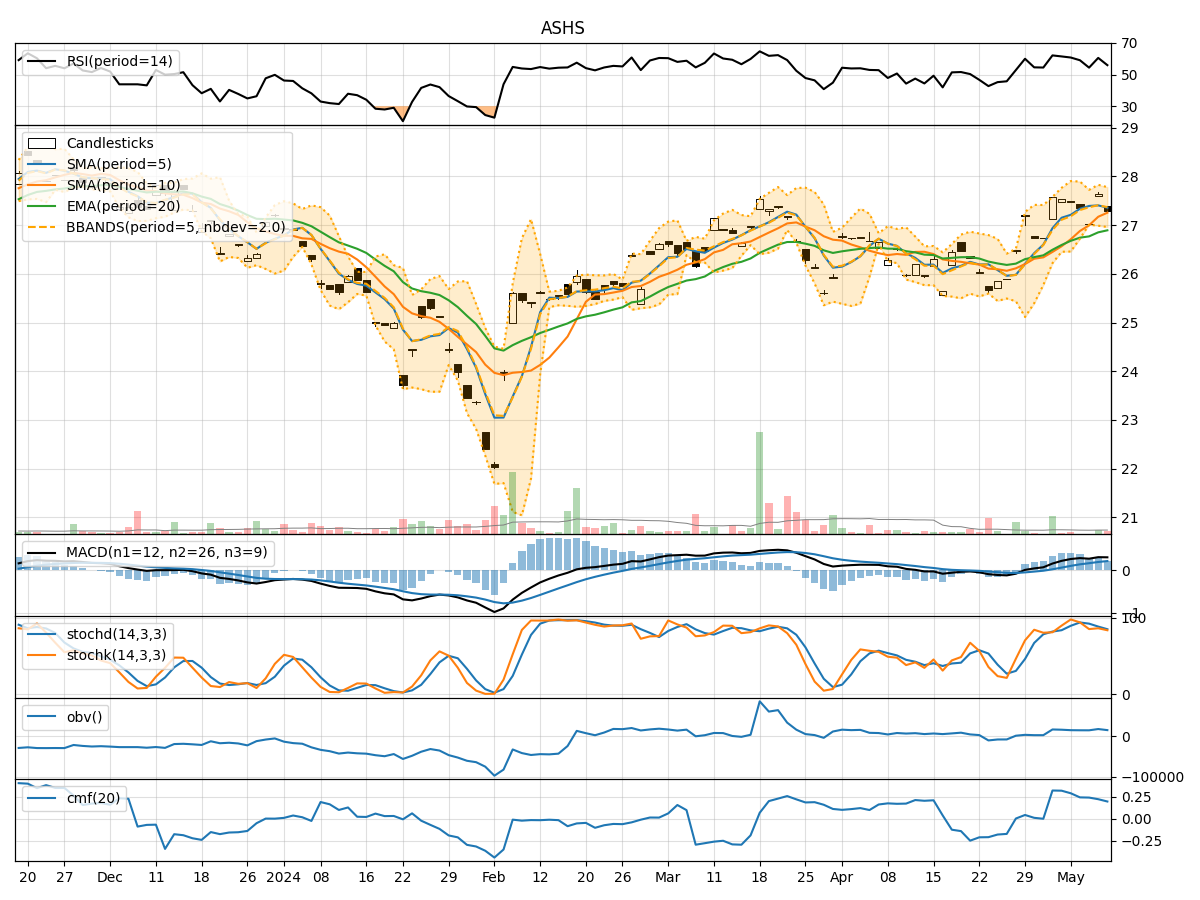
- Moving Averages (MA): The 5-day moving average has been consistently above the simple moving average (SMA) and exponential moving average (EMA), indicating a bullish trend.
- MACD: The MACD line has been above the signal line, with both lines showing an upward trend, suggesting positive momentum.
Momentum Indicators:
- RSI: The Relative Strength Index (RSI) has been fluctuating around the 50 level, indicating a neutral momentum.
- Stochastic Oscillator: Both %K and %D have been trending downwards, signaling a potential bearish momentum.
Volatility Indicators:
- Bollinger Bands (BB): The stock price has been trading within the bands, with the %B indicator hovering around the midline, suggesting a period of consolidation.
Volume Indicators:
- On-Balance Volume (OBV): The OBV has shown mixed signals, with no clear trend in volume accumulation or distribution.
- Chaikin Money Flow (CMF): The CMF has been relatively stable, indicating a neutral sentiment towards the stock.
Key Observations:
- The trend indicators point towards a bullish sentiment, supported by the moving averages and MACD.
- Momentum indicators, particularly the Stochastic Oscillator, suggest a potential shift towards a bearish momentum.
- Volatility indicators indicate a period of consolidation, with the stock price trading within the Bollinger Bands.
- Volume indicators show mixed signals, with no clear trend in volume accumulation or distribution.
Conclusion:
Based on the analysis of the technical indicators, the next few days' possible stock price movement for ASHS is likely to be sideways or consolidation. While the trend indicators suggest a bullish sentiment, the momentum indicators hint at a potential bearish shift. The volatility indicators indicate a period of consolidation, further supporting the sideways movement. Therefore, it is recommended to closely monitor the price action and key support/resistance levels for potential trading opportunities.