Technical Analysis of ATFV 2024-05-10
Overview:
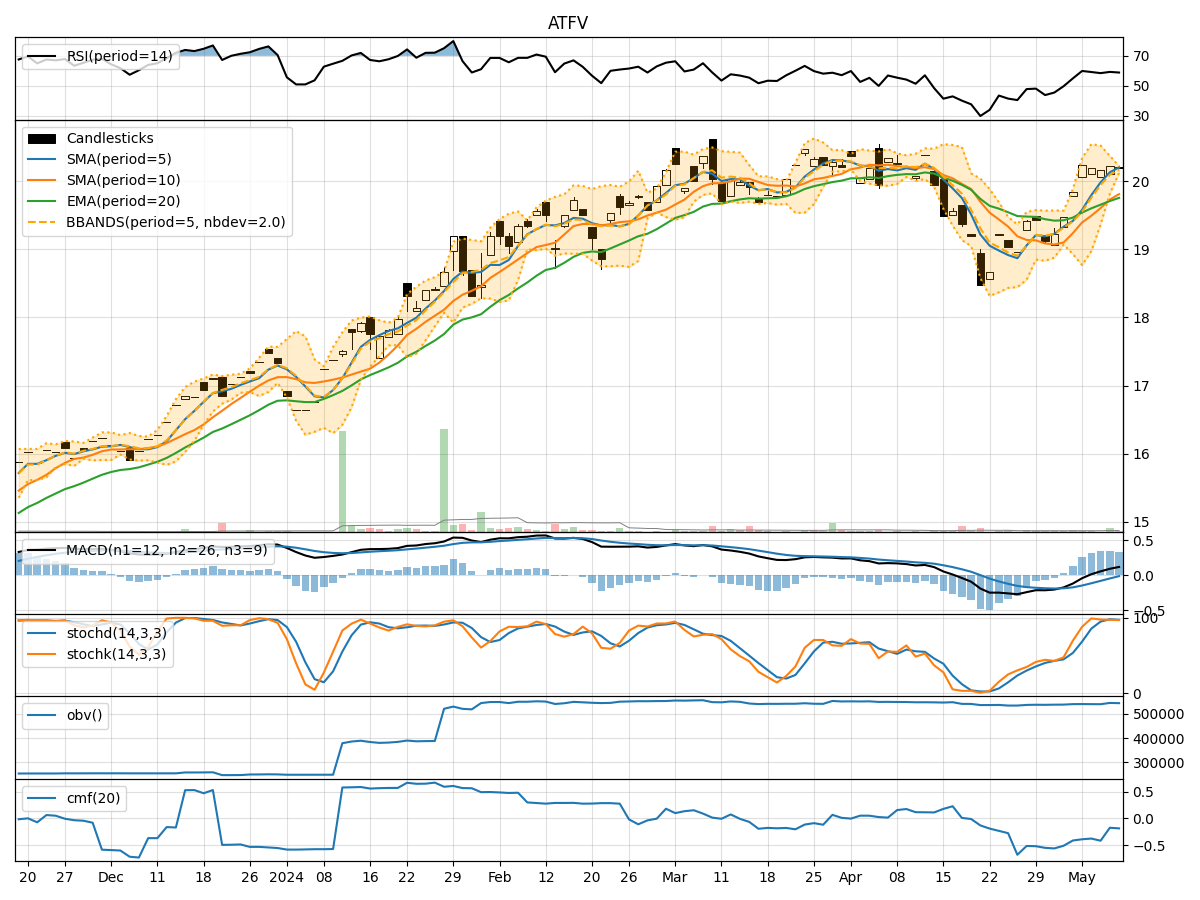
In analyzing the technical indicators for ATFV over the last 5 days, we will delve into the trend, momentum, volatility, and volume indicators to provide a comprehensive assessment of the stock's potential price movement. By examining these key factors, we aim to offer valuable insights and predictions for the next few days.
Trend Analysis:
- Moving Averages (MA): The 5-day MA has been consistently above the closing prices, indicating a bullish trend.
- MACD: The MACD line has been above the signal line, suggesting a bullish momentum.
- RSI: The RSI values have been fluctuating around the 50 level, indicating a neutral stance.
Key Observation: The trend indicators suggest a bullish sentiment in the short term.
Momentum Analysis:
- Stochastic Oscillator: Both %K and %D have been hovering in the overbought territory, signaling a potential reversal.
- Williams %R: The indicator has been in the oversold region, hinting at a possible upward movement.
Key Observation: Momentum indicators show conflicting signals, with stochastic indicating a possible reversal and Williams %R suggesting a bullish momentum.
Volatility Analysis:
- Bollinger Bands (BB): The stock price has been trading within the bands, with the bands narrowing, indicating reduced volatility.
Key Observation: Volatility has been decreasing, potentially leading to a period of consolidation or a breakout.
Volume Analysis:
- On-Balance Volume (OBV): The OBV has been fluctuating, indicating indecision among market participants.
- Chaikin Money Flow (CMF): The CMF has been negative, suggesting selling pressure in the stock.
Key Observation: Volume indicators reflect a lack of clear direction in terms of buying or selling pressure.
Conclusion:
Based on the analysis of the technical indicators, the next few days for ATFV could see sideways movement with a slight bullish bias. The trend indicators point towards a bullish sentiment, while momentum indicators show conflicting signals. Volatility is decreasing, indicating a potential consolidation phase, and volume indicators suggest a lack of clear direction from market participants.
Overall, a cautious approach is recommended, considering the mixed signals from the indicators. Traders and investors should closely monitor key levels and wait for more clarity in the price action before making significant trading decisions.