Technical Analysis of AUGT 2024-05-10
Overview:
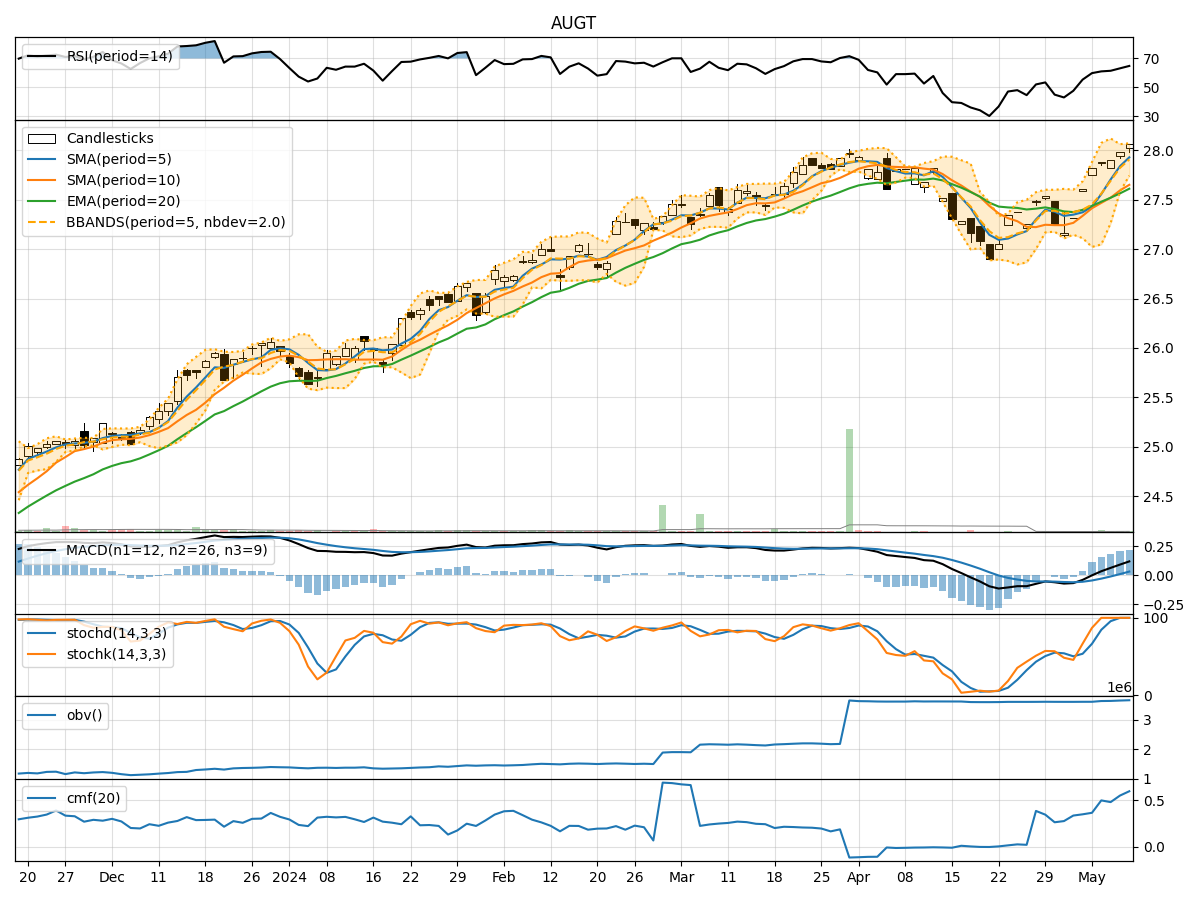
In analyzing the technical indicators for AUGT over the last 5 days, we will delve into the trend, momentum, volatility, and volume indicators to provide a comprehensive outlook on the possible stock price movement in the coming days.
Trend Analysis:
- Moving Averages (MA): The 5-day Moving Average (MA) has been consistently rising, indicating an upward trend in the stock price.
- MACD: The MACD line has been consistently above the signal line, suggesting bullish momentum.
- EMA: The Exponential Moving Average (EMA) has been trending upwards, supporting the bullish sentiment.
Momentum Analysis:
- RSI: The Relative Strength Index (RSI) has been increasing, indicating strengthening momentum.
- Stochastic Oscillator: Both %K and %D have been at 100%, signaling strong buying pressure.
- Williams %R: The Williams %R is at 0, indicating the stock is in oversold territory.
Volatility Analysis:
- Bollinger Bands: The stock price has been trading near the upper Bollinger Band, suggesting high volatility.
- Bollinger %B: The %B is above 0.8, indicating the stock is overbought.
- Average True Range (ATR): The ATR has been relatively stable, indicating consistent volatility levels.
Volume Analysis:
- On-Balance Volume (OBV): The OBV has been steadily increasing, reflecting strong buying volume.
- Chaikin Money Flow (CMF): The CMF is positive, indicating money flow into the stock.
Key Observations:
- The stock is in a strong uptrend based on moving averages and MACD.
- Momentum indicators suggest strong buying pressure and bullish sentiment.
- Volatility is high, indicating potential price swings.
- Volume indicators show increasing buying volume and positive money flow.
Conclusion:
Based on the analysis of technical indicators, the next few days' possible stock price movement for AUGT is upward. The stock is likely to continue its bullish trend, supported by strong momentum, increasing buying volume, and positive money flow. Traders and investors may consider taking long positions or holding onto existing positions to capitalize on the expected upward movement in the stock price.