Technical Analysis of AUGW 2024-05-10
Overview:
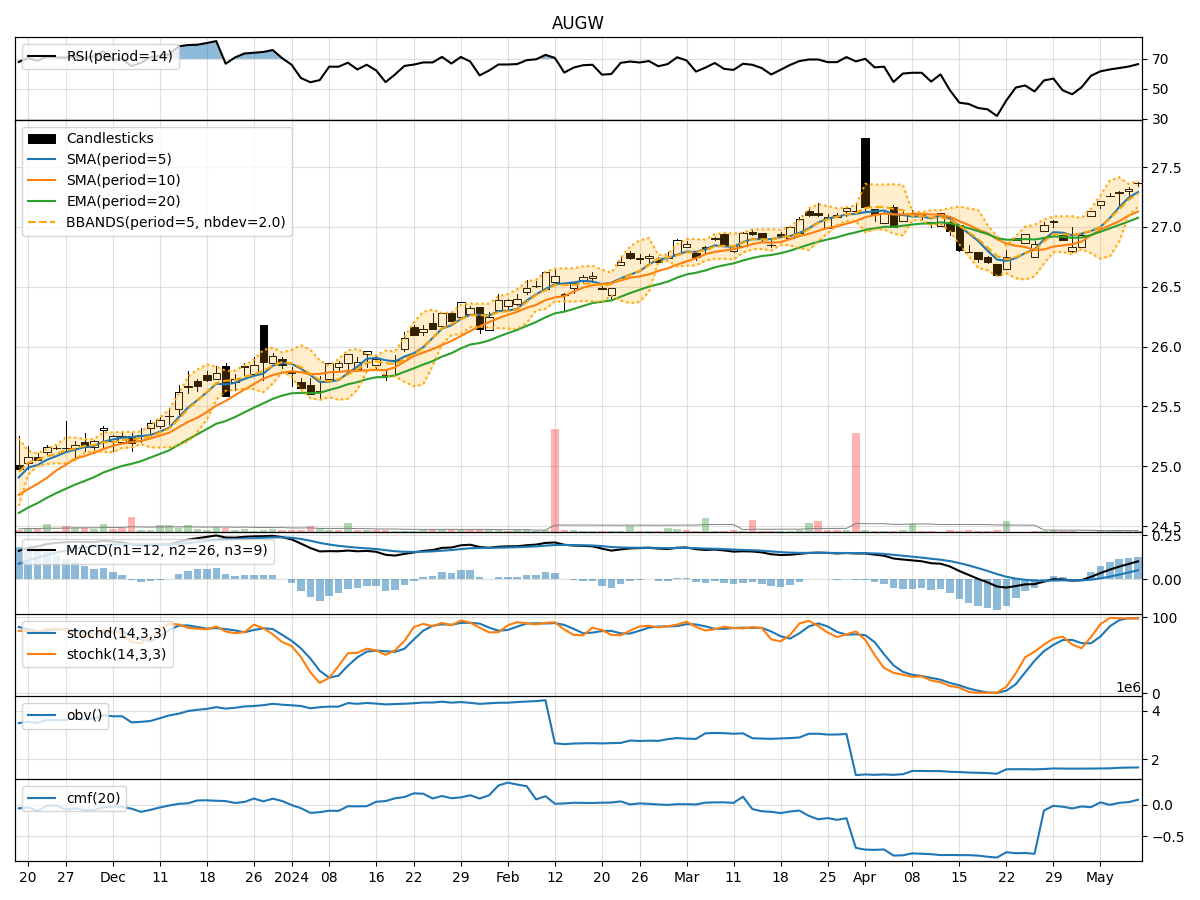
In analyzing the technical indicators for AUGW over the last 5 days, we will delve into the trend, momentum, volatility, and volume indicators to provide a comprehensive outlook on the possible stock price movement. By examining these key aspects, we aim to offer valuable insights and predictions for the upcoming trading days.
Trend Analysis:
- Moving Averages (MA): The 5-day Moving Average (MA) has been consistently above the Simple Moving Average (SMA) and Exponential Moving Average (EMA), indicating a bullish trend.
- MACD: The MACD line has been consistently above the signal line, with both lines showing an upward trend, suggesting bullish momentum.
Key Observation: The trend indicators suggest a strong bullish sentiment in the stock price movement.
Momentum Analysis:
- RSI: The Relative Strength Index (RSI) has been steadily increasing and is currently in the overbought territory, indicating strong buying momentum.
- Stochastic Oscillator: Both %K and %D lines of the Stochastic Oscillator are in the overbought zone, signaling a potential reversal or consolidation.
Key Observation: Momentum indicators point towards a potential short-term pullback or consolidation.
Volatility Analysis:
- Bollinger Bands (BB): The stock price has been trading within the upper Bollinger Band, suggesting an overbought condition.
Key Observation: Volatility indicators indicate a potential reversal or correction in the stock price.
Volume Analysis:
- On-Balance Volume (OBV): The OBV has been decreasing over the last 5 days, indicating a divergence between price and volume.
- Chaikin Money Flow (CMF): The CMF has been positive, suggesting buying pressure in the stock.
Key Observation: Volume indicators show mixed signals, with OBV diverging from price movement.
Conclusion:
Based on the analysis of the technical indicators, the stock of AUGW is currently in an overbought condition with strong bullish momentum. However, the overbought signals from the Stochastic Oscillator and Bollinger Bands, coupled with the divergence in OBV, indicate a potential short-term pullback or consolidation in the stock price.
Recommendation:
Considering the mixed signals from the indicators, it is advisable to exercise caution in entering new long positions at the current levels. Traders may consider booking profits on existing positions or implementing risk management strategies to navigate the potential short-term correction. Monitoring the price action closely for signs of a reversal or continuation of the bullish trend is crucial for making informed trading decisions.