Technical Analysis of AUMI 2024-05-10
Overview:
In analyzing the technical indicators for AUMI stock over the last 5 days, we will delve into the trend, momentum, volatility, and volume indicators to provide a comprehensive outlook on the possible future stock price movement. By examining these key indicators, we aim to offer valuable insights and predictions for the upcoming trading days.
Trend Indicators:
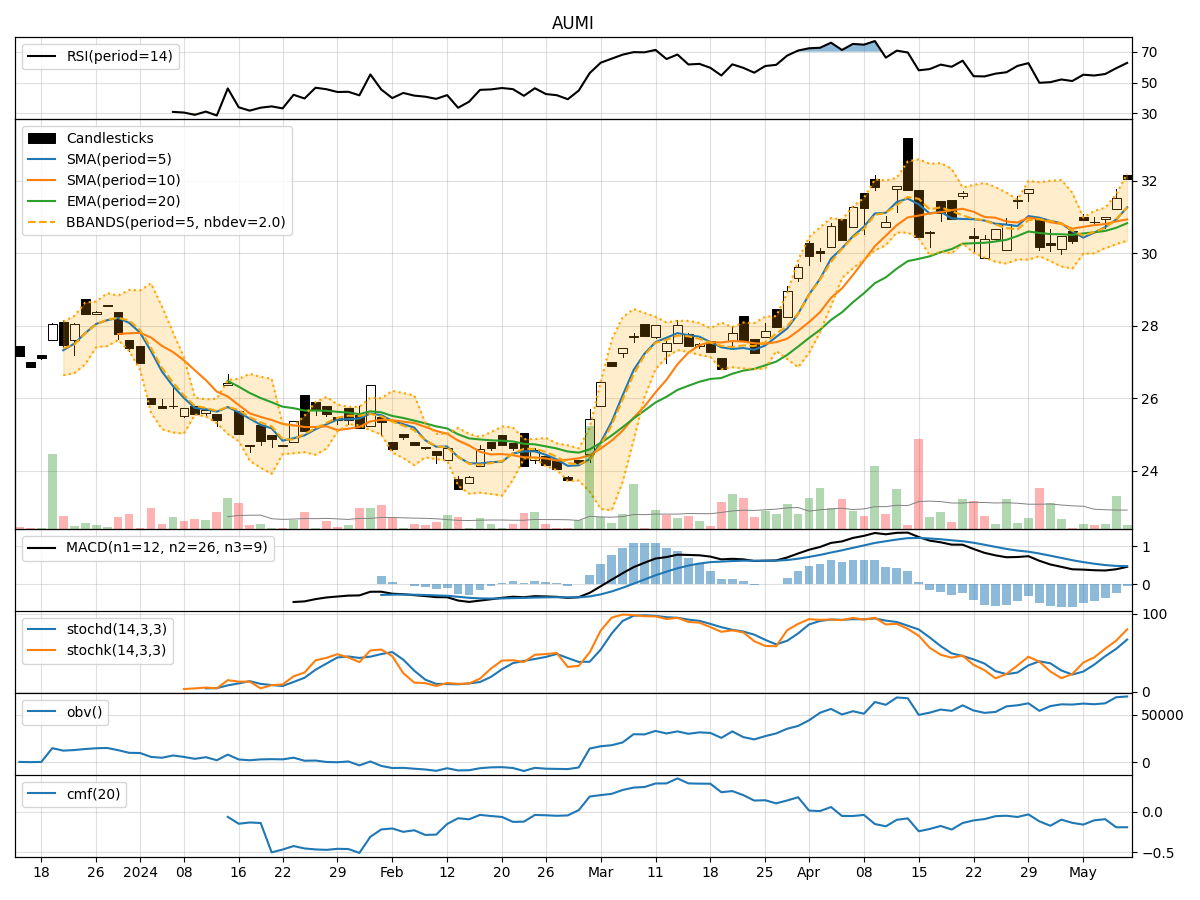
- Moving Averages (MA): The 5-day Moving Average (MA) has been consistently trending upwards, indicating a positive momentum in the stock price.
- MACD: The Moving Average Convergence Divergence (MACD) has shown a positive trend with the MACD line consistently above the signal line, suggesting bullish momentum.
- RSI: The Relative Strength Index (RSI) has been increasing, indicating strengthening buying pressure in the stock.
Key Observation: The trend indicators suggest a bullish outlook for AUMI stock.
Momentum Indicators:
- Stochastic Oscillator: Both %K and %D lines of the Stochastic Oscillator are in the overbought zone, indicating a strong upward momentum.
- Williams %R: The Williams %R is also in the overbought territory, signaling a potential reversal in the short term.
Key Observation: Momentum indicators point towards a potential short-term correction due to overbought conditions.
Volatility Indicators:
- Bollinger Bands: The Bollinger Bands have been widening, indicating increased volatility in the stock price.
- Average True Range (ATR): ATR has shown an uptrend, suggesting an increase in volatility.
Key Observation: Volatility indicators suggest heightened price fluctuations in the near term.
Volume Indicators:
- On-Balance Volume (OBV): The OBV has been relatively stable, indicating a balance between buying and selling pressure.
- Chaikin Money Flow (CMF): The CMF has been negative, suggesting a slight outflow of money from the stock.
Key Observation: Volume indicators reflect a neutral sentiment with a slight bearish bias.
Conclusion:
Based on the analysis of the technical indicators, the stock price of AUMI is likely to experience short-term correction due to overbought conditions indicated by momentum indicators. However, the overall trend remains bullish supported by moving averages and MACD. Volatility is expected to remain high, leading to increased price fluctuations. Volume indicators suggest a neutral to slightly bearish sentiment.
Recommendation:
- Short-term Traders: Consider taking profits or implementing risk management strategies due to overbought conditions.
- Long-term Investors: The bullish trend remains intact, so holding positions with a long-term perspective could be beneficial.
- Risk-Averse Investors: Exercise caution due to increased volatility and monitor the stock closely for potential entry or exit points.
Disclaimer:
Remember that technical analysis is not foolproof and should be used in conjunction with other forms of analysis. Market conditions can change rapidly, so it's essential to stay informed and adapt your strategies accordingly.