Technical Analysis of AUSF 2024-05-10
Overview:
In analyzing the technical indicators for AUSF stock over the last 5 days, we will delve into the trends, momentum, volatility, and volume indicators to provide a comprehensive outlook on the possible stock price movement in the coming days. By examining these key aspects, we aim to offer valuable insights and predictions for informed decision-making.
Trend Indicators:
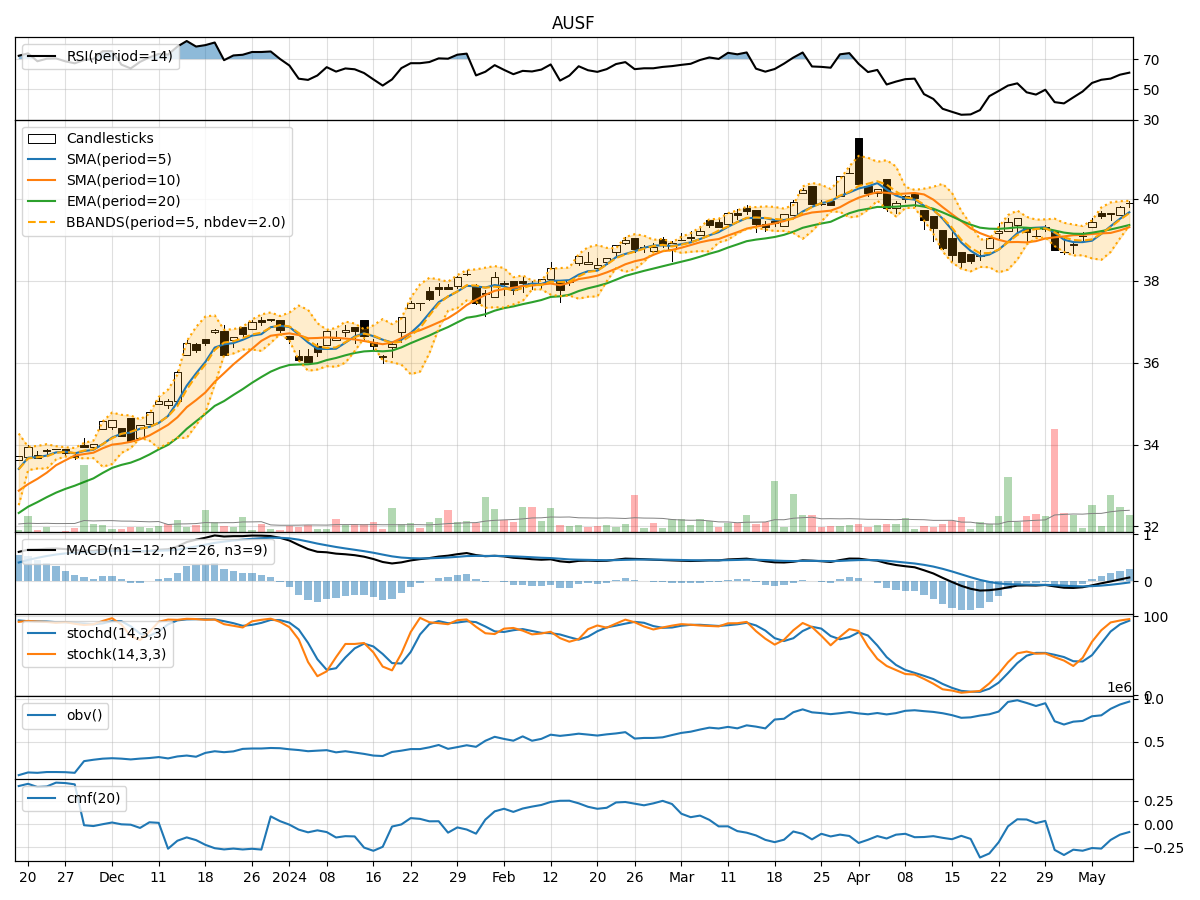
- Moving Averages (MA): The 5-day moving average has been consistently above the simple moving average (SMA) and exponential moving average (EMA), indicating a short-term uptrend.
- MACD: The MACD line has been positive and increasing, suggesting bullish momentum.
- MACD Histogram: The histogram has been rising, indicating strengthening bullish momentum.
Momentum Indicators:
- RSI: The Relative Strength Index (RSI) has been increasing, showing growing buying pressure.
- Stochastic Oscillator: Both %K and %D have been in overbought territory, signaling a strong bullish momentum.
- Williams %R: The indicator has been in oversold territory, suggesting a potential reversal to the upside.
Volatility Indicators:
- Bollinger Bands: The stock price has been trading within the bands, indicating normal volatility.
- Bollinger %B: The %B indicator has been fluctuating around the midline, suggesting a balanced market sentiment.
Volume Indicators:
- On-Balance Volume (OBV): The OBV has been increasing, indicating accumulation by investors.
- Chaikin Money Flow (CMF): The CMF has been negative, suggesting some selling pressure in the market.
Key Observations:
- The trend indicators point towards a bullish sentiment with moving averages and MACD signaling an upward trend.
- Momentum indicators reflect strong buying pressure with RSI and Stochastic Oscillator in overbought territory.
- Volatility indicators show normal price fluctuations within the Bollinger Bands.
- Volume indicators indicate accumulation based on OBV, but some selling pressure according to CMF.
Conclusion:
Based on the analysis of the technical indicators, the next few days are likely to see continued upward movement in AUSF stock price. The bullish trend, supported by strong momentum and normal volatility, suggests a favorable outlook for investors. However, it is essential to monitor the indicators closely for any signs of potential reversal or increased selling pressure. Overall, the current technical analysis points towards a bullish view for AUSF stock in the near term.