Technical Analysis of AVDE 2024-05-10
Overview:
In analyzing the technical indicators for AVDE stock over the last 5 days, we will delve into the trend, momentum, volatility, and volume indicators to provide a comprehensive outlook on the possible future stock price movement. By examining these key indicators, we aim to offer valuable insights and recommendations for potential investors.
Trend Analysis:
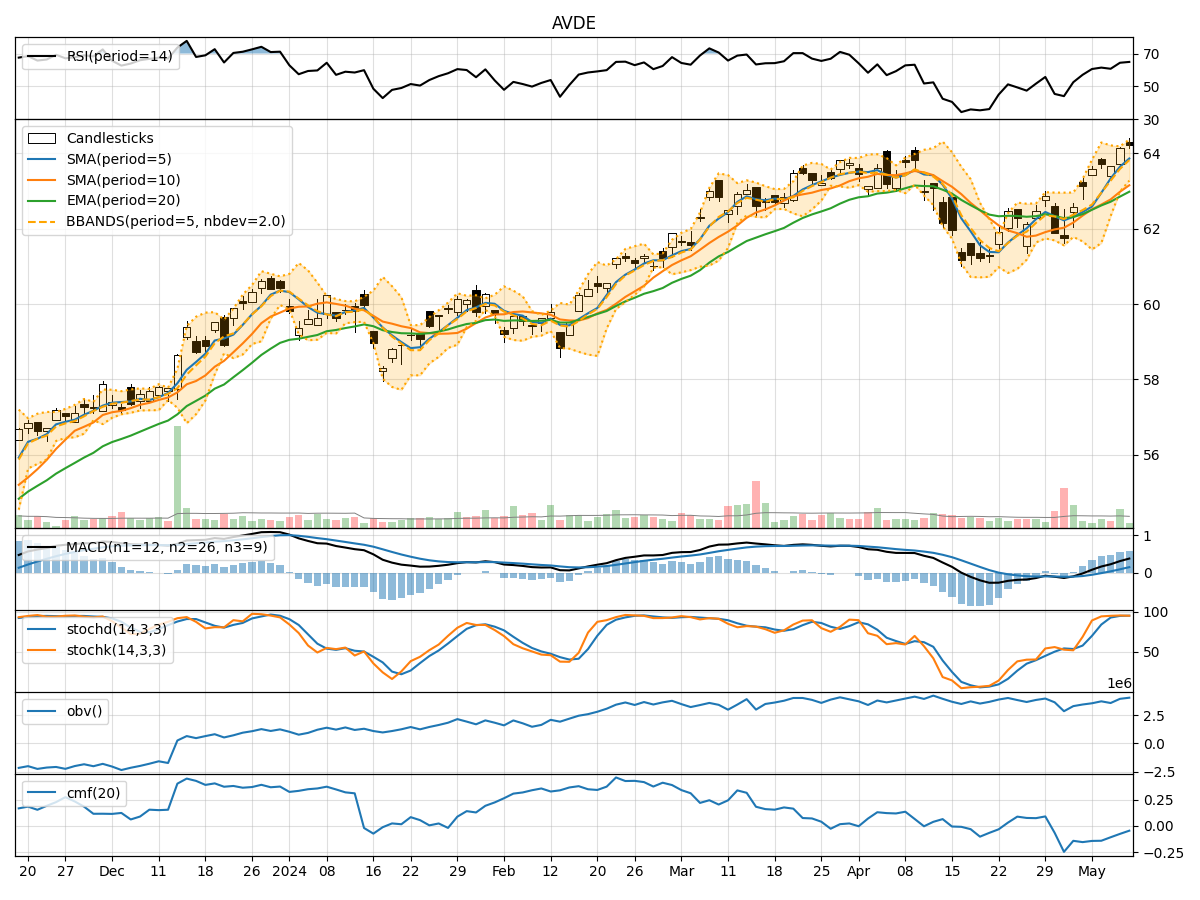
- Moving Averages (MA): The 5-day Moving Average (MA) has been consistently above the Simple Moving Average (SMA) and Exponential Moving Average (EMA), indicating a bullish trend.
- MACD: The MACD line has been consistently above the signal line, with increasing values, suggesting a strengthening bullish momentum.
- MACD Histogram: The MACD Histogram has been showing positive values, indicating an uptrend.
Momentum Analysis:
- RSI: The Relative Strength Index (RSI) has been gradually increasing and is currently in the overbought territory, signaling a strong bullish momentum.
- Stochastic Oscillator: Both %K and %D lines of the Stochastic Oscillator are in the overbought zone, indicating a potential reversal or consolidation.
- Williams %R: The Williams %R is in the oversold region, suggesting a possible reversal in the short term.
Volatility Analysis:
- Bollinger Bands: The stock price has been trading within the Bollinger Bands, with the bands narrowing, indicating decreasing volatility.
- Bollinger %B: The %B indicator is hovering around 0.8, suggesting the stock is trading near the upper band.
Volume Analysis:
- On-Balance Volume (OBV): The OBV indicator has been fluctuating but showing a slight decrease, indicating some distribution.
- Chaikin Money Flow (CMF): The CMF has been negative, suggesting selling pressure in the stock.
Key Observations:
- The trend indicators point towards a strong bullish sentiment in the stock.
- Momentum indicators indicate a potential overbought scenario, signaling a caution for investors.
- Volatility has been decreasing, indicating a possible period of consolidation.
- Volume indicators show mixed signals with slight distribution and selling pressure.
Conclusion:
Based on the analysis of the technical indicators, the next few days for AVDE stock could see a continuation of the bullish trend but with a possibility of a short-term pullback or consolidation due to the overbought conditions highlighted by the momentum indicators. Investors should closely monitor the price action and consider potential profit-taking opportunities in the near term.