Technical Analysis of AVDS 2024-05-10
Overview:
In analyzing the technical indicators for AVDS over the last 5 days, we will delve into the trend, momentum, volatility, and volume indicators to provide a comprehensive outlook on the possible stock price movement in the coming days. By examining these key aspects, we aim to offer valuable insights and recommendations for potential investors.
Trend Analysis:
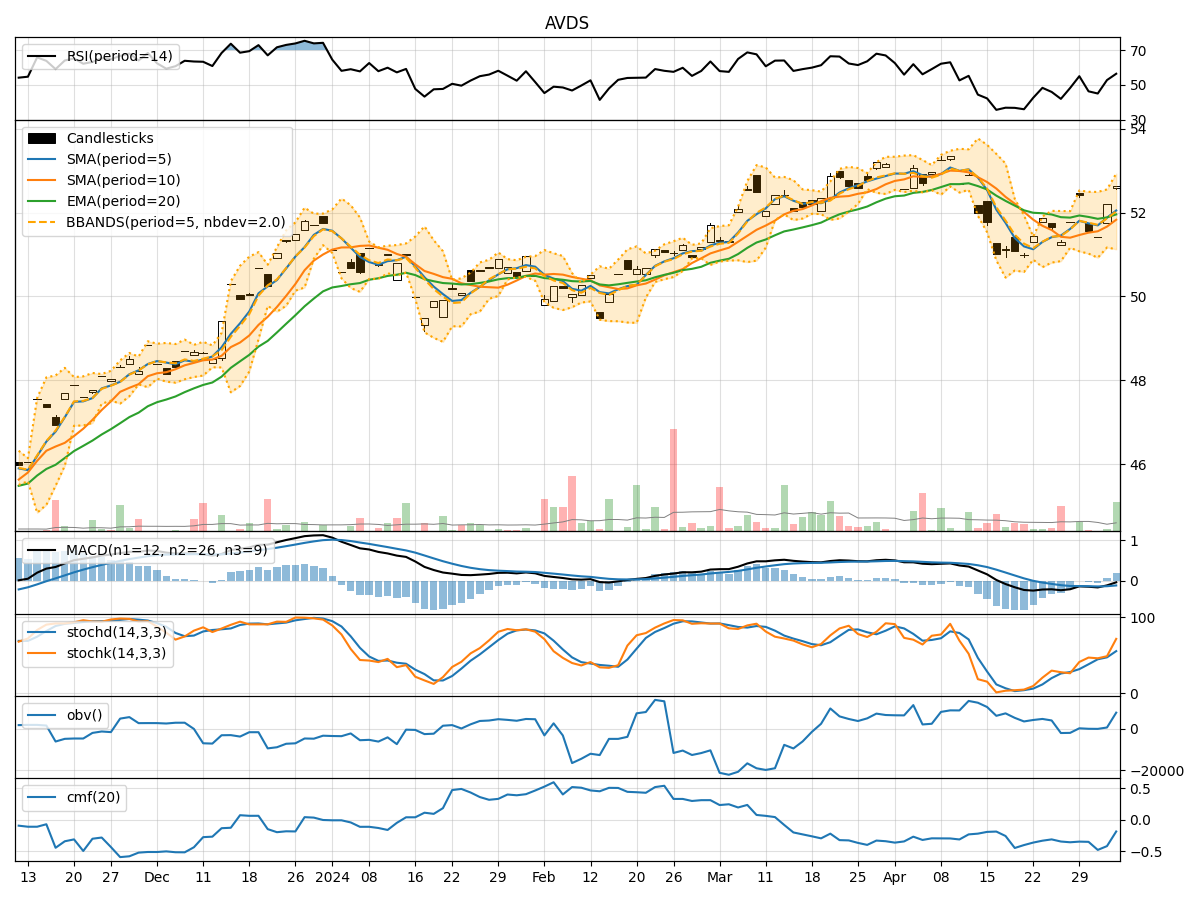
- Moving Averages (MA): The 5-day MA has been consistently above the 10-day SMA, indicating a short-term bullish trend.
- MACD: The MACD line has been trending upwards, with the MACD histogram showing positive values, suggesting a strengthening bullish momentum.
- Relative Strength Index (RSI): The RSI has been fluctuating around the overbought territory, indicating a strong bullish sentiment.
Momentum Analysis:
- Stochastic Oscillator: Both %K and %D have been in the overbought zone, suggesting a potential reversal or consolidation.
- Williams %R (WillR): The indicator has been hovering in the oversold region, signaling a possible buying opportunity.
Volatility Analysis:
- Bollinger Bands (BB): The stock price has been trading within the bands, indicating a period of consolidation.
- Bollinger %B (BBP): The %B value has been fluctuating around 0.7, suggesting a neutral stance.
Volume Analysis:
- On-Balance Volume (OBV): The OBV has shown slight fluctuations, indicating a balanced buying and selling pressure.
- Chaikin Money Flow (CMF): The CMF has been negative, reflecting a slight bearish sentiment in the market.
Key Observations:
- The trend indicators suggest a bullish outlook in the short term.
- Momentum indicators show signs of potential reversal or consolidation.
- Volatility indicators point towards a period of consolidation.
- Volume indicators indicate a balanced market sentiment with a slight bearish bias.
Conclusion:
Based on the analysis of the technical indicators, the next few days for AVDS stock price movement could see further upside potential in the short term, supported by the bullish trend indicators and positive momentum. However, caution is advised as the momentum indicators hint at a possible reversal or consolidation. The volatility indicators suggest a period of consolidation, while volume indicators reflect a balanced market sentiment with a slight bearish bias. Overall, a cautiously bullish view is recommended for the next few days.