Technical Analysis of AVDV 2024-05-10
Overview:
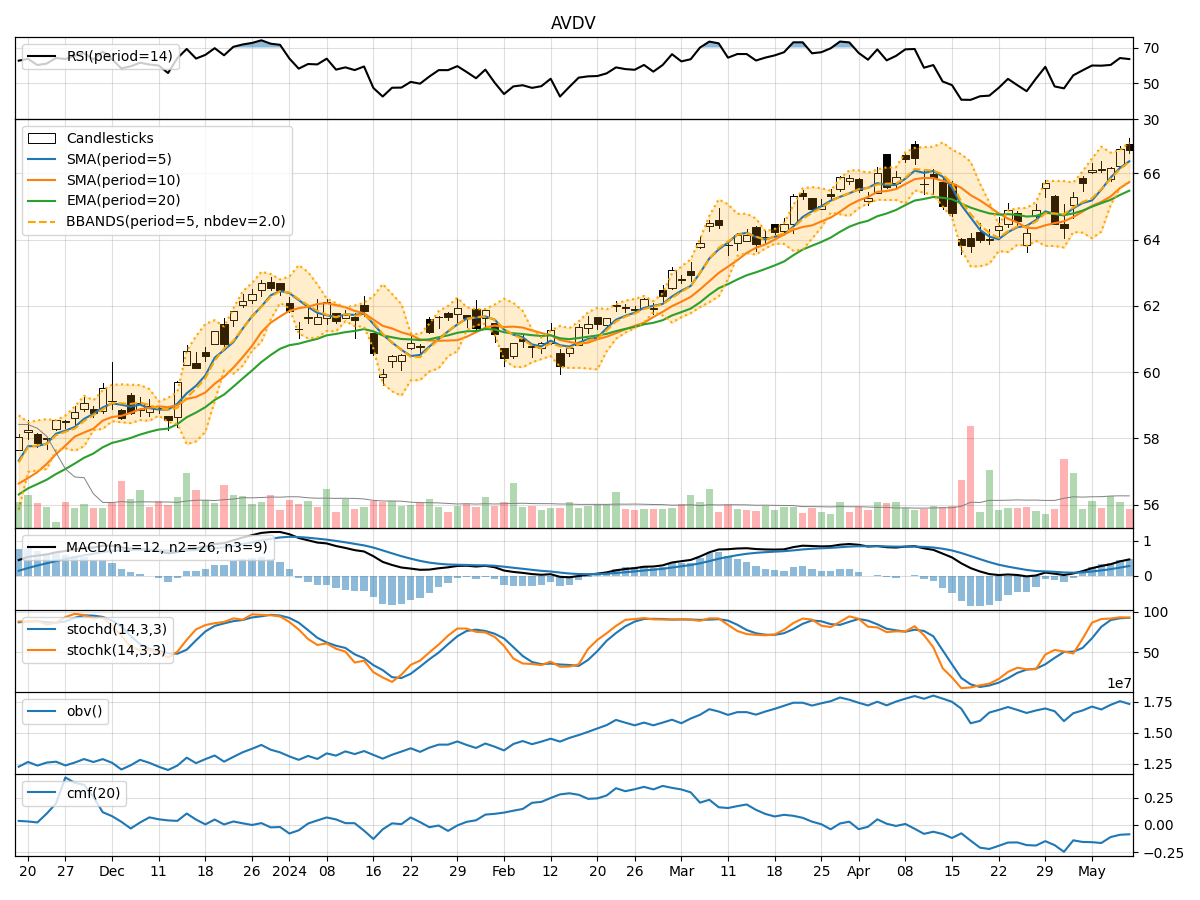
In analyzing the technical indicators for AVDV over the last 5 days, we will delve into the trend, momentum, volatility, and volume indicators to provide a comprehensive outlook on the possible stock price movement in the coming days.
Trend Indicators:
- Moving Averages (MA): The 5-day MA has been consistently above the closing prices, indicating a bullish trend.
- MACD: The MACD line has been above the signal line, with both showing an upward trend, suggesting bullish momentum.
- EMA: The exponential moving average has been steadily increasing, supporting the bullish sentiment.
Momentum Indicators:
- RSI: The RSI has been in the overbought territory, indicating strong buying momentum.
- Stochastic Oscillator: Both %K and %D have been in the overbought zone, signaling a strong bullish momentum.
- Williams %R: The indicator has been in the oversold region, suggesting a potential reversal to the upside.
Volatility Indicators:
- Bollinger Bands (BB): The bands have been narrowing, indicating decreasing volatility and a possible consolidation phase.
- BB %B: The %B indicator has been hovering around 0.7, suggesting a neutral stance in terms of volatility.
Volume Indicators:
- On-Balance Volume (OBV): The OBV has been relatively stable, indicating a balance between buying and selling pressure.
- Chaikin Money Flow (CMF): The CMF has been negative, suggesting a slight distribution phase.
Key Observations and Opinions:
- Trend: The trend indicators point towards a strong bullish sentiment in the stock.
- Momentum: Momentum indicators reflect a robust buying momentum in the market.
- Volatility: Volatility indicators suggest a potential consolidation phase in the near term.
- Volume: Volume indicators indicate a balanced buying and selling pressure.
Conclusion:
Based on the analysis of the technical indicators, the next few days for AVDV are likely to see continued upward movement in the stock price. The bullish trend, strong momentum, and stable volume support the outlook for further price appreciation. However, the narrowing Bollinger Bands suggest a possible consolidation phase before another leg up. Traders and investors can consider buying on dips as the overall trend remains bullish.