Technical Analysis of AVEE 2024-05-10
Overview:
In analyzing the technical indicators for AVEE stock over the last 5 days, we will delve into the trend, momentum, volatility, and volume indicators to provide a comprehensive outlook on the possible stock price movement in the coming days. By examining these key indicators, we aim to offer valuable insights and predictions for informed decision-making.
Trend Analysis:
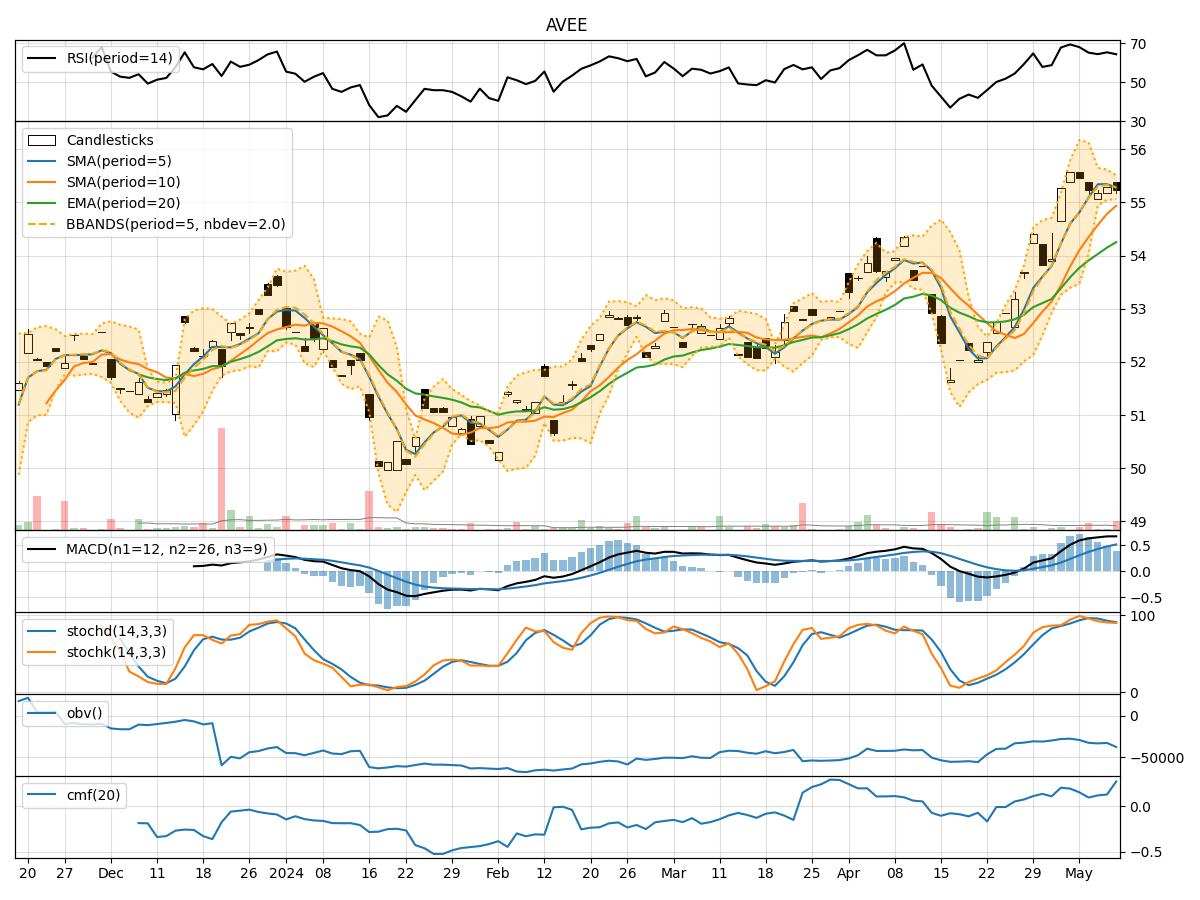
- Moving Averages (MA): The 5-day Moving Average (MA) has been consistently above the Simple Moving Average (SMA) and Exponential Moving Average (EMA), indicating a bullish trend.
- MACD: The MACD line has been above the signal line, with both lines showing an upward trend, suggesting bullish momentum.
Momentum Analysis:
- RSI: The Relative Strength Index (RSI) has been fluctuating around the 60-70 range, indicating a neutral to slightly bullish momentum.
- Stochastic Oscillator: Both %K and %D have been gradually decreasing but remain in the overbought territory, signaling a potential reversal.
Volatility Analysis:
- Bollinger Bands (BB): The stock price has been trading within the Bollinger Bands, with the bands narrowing, suggesting decreasing volatility.
Volume Analysis:
- On-Balance Volume (OBV): The OBV has shown mixed movements, indicating indecision among investors.
- Chaikin Money Flow (CMF): The CMF has been positive, reflecting buying pressure in the market.
Key Observations:
- The trend indicators suggest a strong bullish sentiment in the short term.
- Momentum indicators show a potential weakening of bullish momentum.
- Volatility has been decreasing, indicating a possible period of consolidation.
- Volume indicators reflect mixed signals, with no clear direction in investor sentiment.
Conclusion:
Based on the analysis of the technical indicators, the next few days for AVEE stock could see sideways movement or a slight correction in price. While the trend remains bullish, the weakening momentum and decreasing volatility suggest a possible period of consolidation. Investors should closely monitor key support and resistance levels for potential entry or exit points. It is advisable to exercise caution and wait for clearer signals before making significant trading decisions.