Technical Analysis of AVMA 2024-05-10
Overview:
In analyzing the technical indicators for AVMA over the last 5 days, we will delve into the trend, momentum, volatility, and volume indicators to provide a comprehensive outlook on the possible stock price movement in the coming days. By examining these key aspects, we aim to offer valuable insights and predictions for informed decision-making.
Trend Indicators:
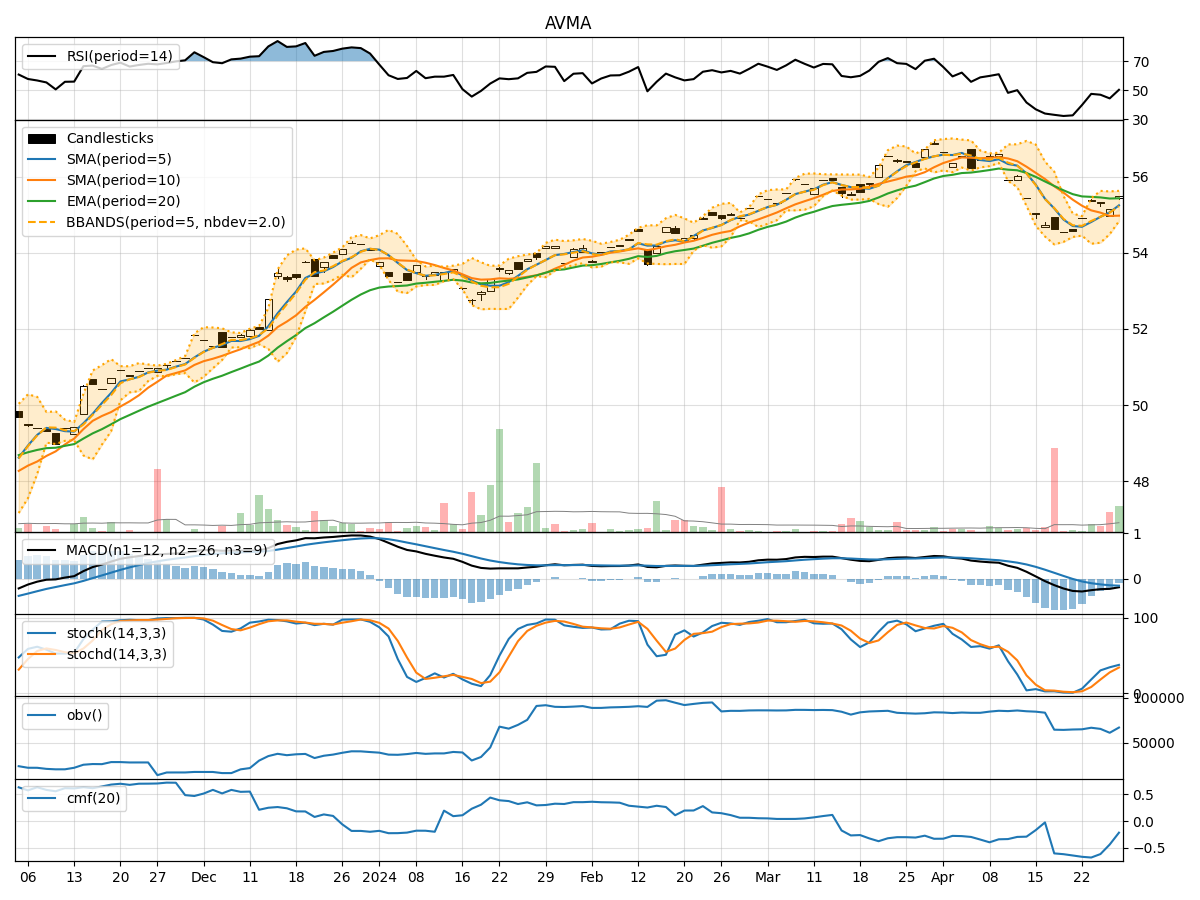
- Moving Averages (MA): The 5-day MA has been consistently above the 10-day SMA, indicating a short-term bullish trend. The EMA(20) has shown a gradual uptrend, suggesting positive momentum in the stock price.
- MACD: The MACD line has been above the signal line for the past 5 days, indicating a bullish trend. The MACD histogram has been increasing, reflecting strengthening bullish momentum.
Momentum Indicators:
- RSI: The RSI has been in the overbought territory, indicating a strong bullish momentum in the stock. However, caution is advised as it may signal a potential reversal.
- Stochastic Oscillator: Both %K and %D have been in the overbought zone, suggesting a strong upward momentum. Traders should be cautious of a possible reversal from these levels.
Volatility Indicators:
- Bollinger Bands (BB): The stock price has been trading within the upper Bollinger Band, indicating an overbought condition. This may suggest a potential pullback or consolidation in the near term.
- Bollinger Band Width (BBW): The BBW has been narrowing, indicating decreasing volatility. This could precede a period of consolidation or a breakout in the stock price.
Volume Indicators:
- On-Balance Volume (OBV): The OBV has been slightly negative, suggesting some distribution in the stock. This may indicate a lack of strong buying interest at current price levels.
- Chaikin Money Flow (CMF): The CMF has been negative, indicating selling pressure in the stock. This could lead to further downside potential in the near term.
Conclusion:
Based on the analysis of the technical indicators, the stock of AVMA is currently in an overbought condition with strong bullish momentum. However, the narrowing Bollinger Bands and negative volume indicators suggest a potential consolidation or pullback in the stock price in the coming days. Traders should exercise caution and consider taking profits or implementing risk management strategies to navigate the expected price movement.