Technical Analysis of AVMC 2024-05-10
Overview:
In analyzing the technical indicators for AVMC over the last 5 days, we will delve into the trend, momentum, volatility, and volume indicators to provide a comprehensive outlook on the possible stock price movement in the coming days. By examining these key aspects, we aim to offer valuable insights and predictions to guide investment decisions.
Trend Analysis:
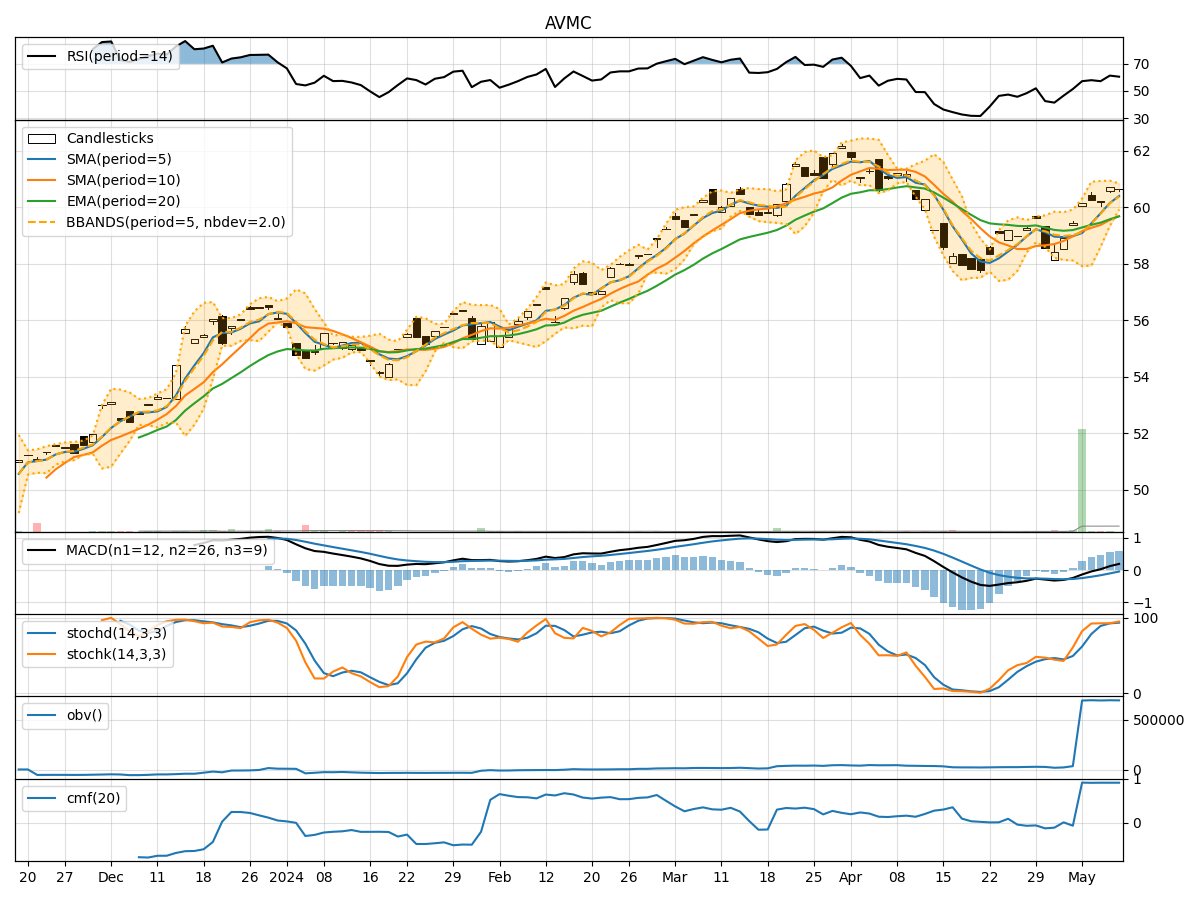
- Moving Averages (MA): The 5-day moving average has been consistently above the longer-term simple moving average (SMA) and exponential moving average (EMA), indicating a bullish trend.
- Moving Average Convergence Divergence (MACD): The MACD line has been above the signal line for the past 5 days, with both lines showing an upward trend, suggesting bullish momentum.
- Conclusion: The trend indicators point towards a bullish outlook for AVMC.
Momentum Analysis:
- Relative Strength Index (RSI): The RSI has been fluctuating but generally staying above 50, indicating bullish momentum.
- Stochastic Oscillator: Both %K and %D have been consistently high, suggesting strong buying pressure.
- Conclusion: Momentum indicators support a bullish sentiment for AVMC.
Volatility Analysis:
- Bollinger Bands (BB): The stock price has been trading within the upper and lower Bollinger Bands, indicating moderate volatility.
- Conclusion: Volatility indicators suggest a sideways movement or a period of consolidation for AVMC.
Volume Analysis:
- On-Balance Volume (OBV): The OBV has been relatively stable, indicating consistent buying volume.
- Chaikin Money Flow (CMF): The CMF has been positive, reflecting strong buying pressure.
- Conclusion: Volume indicators signal a bullish sentiment for AVMC.
Overall Conclusion:
Based on the analysis of trend, momentum, volatility, and volume indicators, the overall outlook for AVMC is bullish. The stock is likely to experience upward price movement in the coming days, supported by strong trends, positive momentum, and healthy buying volume. Investors may consider taking long positions or holding onto existing positions to capitalize on the expected price appreciation.
Key Takeaways:
- Trend: Upward trend supported by moving averages and MACD.
- Momentum: Bullish momentum indicated by RSI and Stochastic Oscillator.
- Volatility: Sideways movement or consolidation expected based on Bollinger Bands.
- Volume: Strong buying volume suggested by OBV and CMF.
Recommendation:
Considering the overall bullish outlook and positive signals across various technical indicators, investors may look for buying opportunities in AVMC. It is essential to monitor the price action closely and set appropriate stop-loss levels to manage risk effectively. Additionally, staying informed about any market developments or news related to the company can further guide investment decisions.
Disclaimer:
This analysis is based solely on technical indicators and historical data, and it is important to conduct thorough research and consider other factors before making investment decisions. Market conditions can change rapidly, impacting stock prices unpredictably. It is advisable to consult with a financial advisor before making any investment choices.