Technical Analysis of AVMU 2024-05-10
Overview:
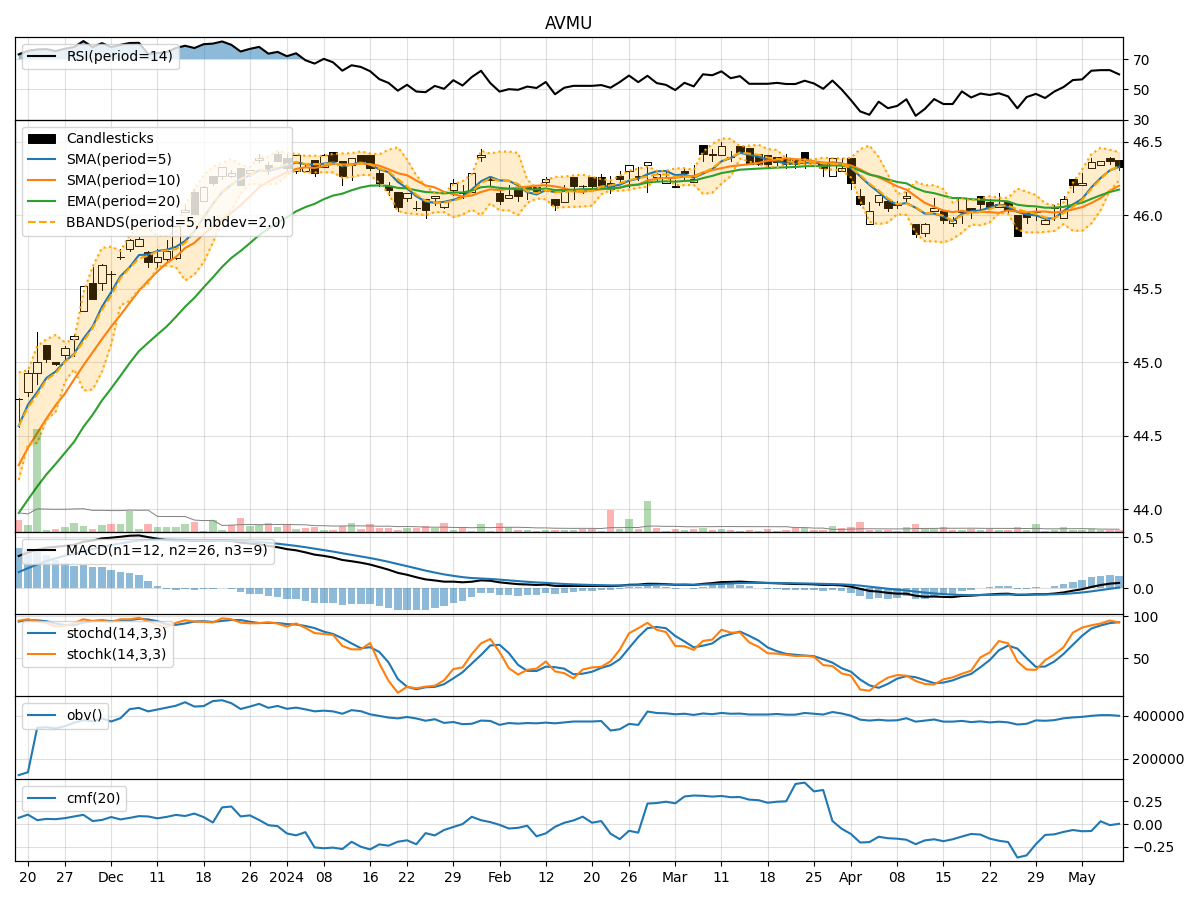
In analyzing the technical indicators for AVMU stock over the last 5 days, we will delve into the trend, momentum, volatility, and volume indicators to provide a comprehensive outlook on the possible stock price movement in the coming days. By examining these key indicators, we aim to offer valuable insights and predictions for potential investors.
Trend Indicators:
- Moving Averages (MA): The 5-day Moving Average (MA) has been trending slightly upwards, indicating a positive momentum in the short term.
- MACD: The Moving Average Convergence Divergence (MACD) has shown a consistent increase over the past 5 days, suggesting a strengthening bullish trend.
- RSI: The Relative Strength Index (RSI) has been fluctuating but generally staying within the neutral to slightly overbought territory.
Key Observation: The trend indicators point towards a bullish sentiment in the short term.
Momentum Indicators:
- Stochastic Oscillator: Both %K and %D values have been relatively high, indicating strong buying momentum.
- Williams %R: The Williams %R is in the oversold region, suggesting a potential reversal in the near future.
Key Observation: Momentum indicators suggest a bullish momentum in the short term.
Volatility Indicators:
- Bollinger Bands: The Bollinger Bands have been narrowing, indicating decreasing volatility and a possible period of consolidation.
- Average True Range (ATR): The ATR has been decreasing, further supporting the notion of reduced volatility.
Key Observation: Volatility indicators signal a sideways movement or consolidation phase.
Volume Indicators:
- On-Balance Volume (OBV): The OBV has shown mixed signals, with some days seeing positive volume accumulation and others showing distribution.
- Chaikin Money Flow (CMF): The CMF has been fluctuating around the zero line, indicating a balance between buying and selling pressure.
Key Observation: Volume indicators suggest a neutral stance with no clear direction.
Conclusion:
Based on the analysis of the technical indicators, the overall outlook for AVMU stock in the next few days leans towards a bullish sentiment in the short term, supported by the positive trend and momentum indicators. However, the narrowing Bollinger Bands and decreasing volatility indicators suggest a potential period of consolidation or sideways movement before a definitive trend continuation.
Investors should closely monitor key levels such as the moving averages and MACD for potential entry or exit points, while also considering the evolving volume dynamics for confirmation of price movements. It is advisable to exercise caution and wait for clearer signals before making significant trading decisions.
Key Conclusion:
- Trend: Upward
- Momentum: Upward
- Volatility: Sideways/Consolidation
- Volume: Neutral
Final Recommendation:
Considering the overall analysis, investors may consider a cautiously bullish approach in the short term, with a focus on monitoring key technical levels and waiting for confirmation of a sustained trend before making significant trading decisions.