Technical Analysis of AVNV 2024-05-10
Overview:
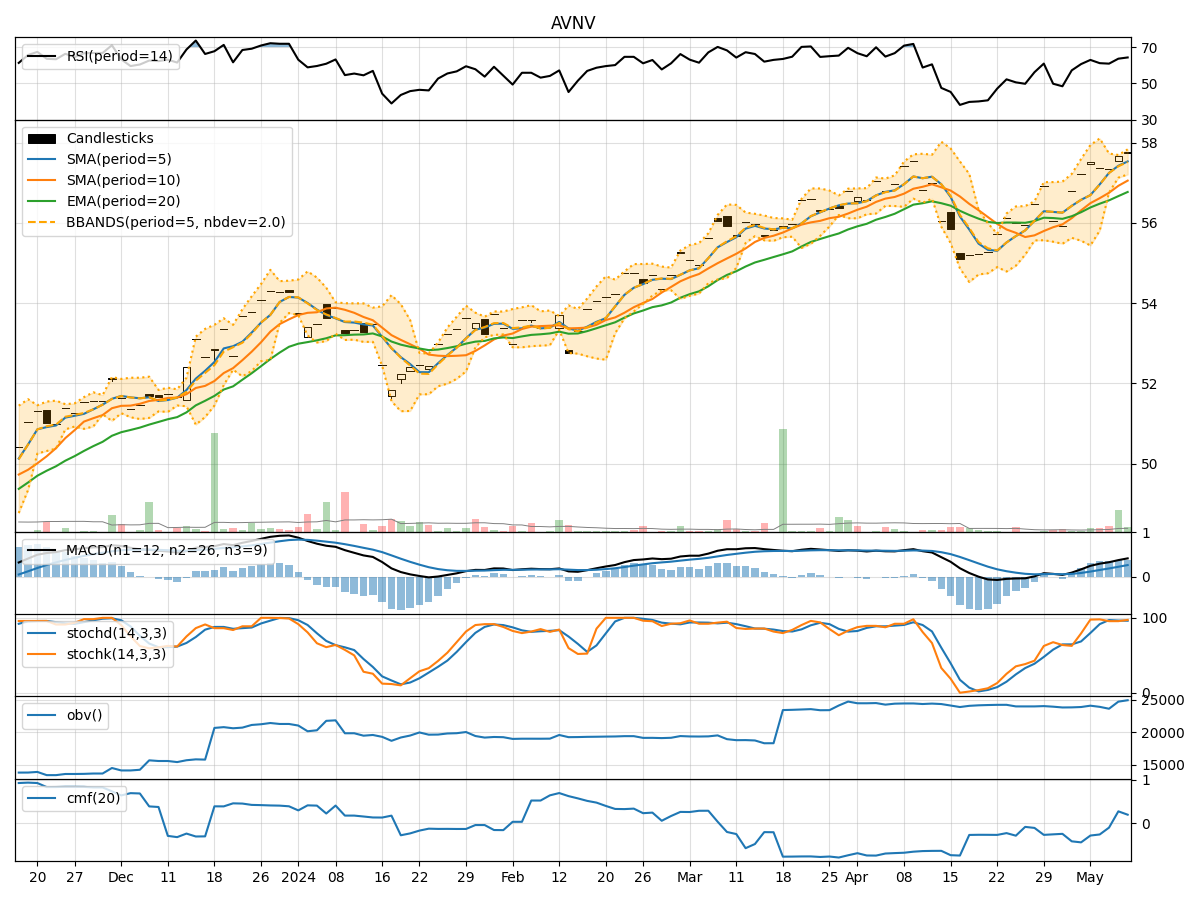
In analyzing the technical indicators for AVNV over the last 5 days, we will delve into the trend, momentum, volatility, and volume indicators to provide a comprehensive outlook on the possible stock price movement. By examining these key aspects, we aim to offer valuable insights and predictions for the upcoming days.
Trend Analysis:
- Moving Averages (MA): The 5-day Moving Average (MA) has been consistently above the Simple Moving Average (SMA) and Exponential Moving Average (EMA), indicating a bullish trend.
- MACD: The MACD line has been consistently above the signal line, with both lines showing an upward trend, suggesting bullish momentum.
- Conclusion: The trend indicators point towards an upward trajectory for AVNV.
Momentum Analysis:
- RSI: The Relative Strength Index (RSI) has been fluctuating around the overbought territory, indicating strong buying momentum.
- Stochastic Oscillator: Both %K and %D have been in the overbought zone, suggesting a strong bullish momentum.
- Conclusion: Momentum indicators signal a bullish sentiment for AVNV.
Volatility Analysis:
- Bollinger Bands (BB): The stock price has been trading within the upper Bollinger Band (BBU), indicating high volatility.
- Conclusion: Volatility indicators suggest a high volatility environment for AVNV.
Volume Analysis:
- On-Balance Volume (OBV): The OBV has shown a positive trend, indicating accumulation by investors.
- Chaikin Money Flow (CMF): The CMF has been negative but improving, suggesting a potential shift towards buying pressure.
- Conclusion: Volume indicators imply positive accumulation and a potential buying pressure for AVNV.
Conclusion:
Based on the analysis of trend, momentum, volatility, and volume indicators, the overall outlook for AVNV is bullish. The stock is likely to experience upward price movement in the next few days. Traders and investors may consider taking long positions or holding onto existing positions to capitalize on the expected uptrend. However, it is essential to monitor the indicators closely for any signs of reversal or divergence to adjust trading strategies accordingly.