Technical Analysis of AVSC 2024-05-10
Overview:
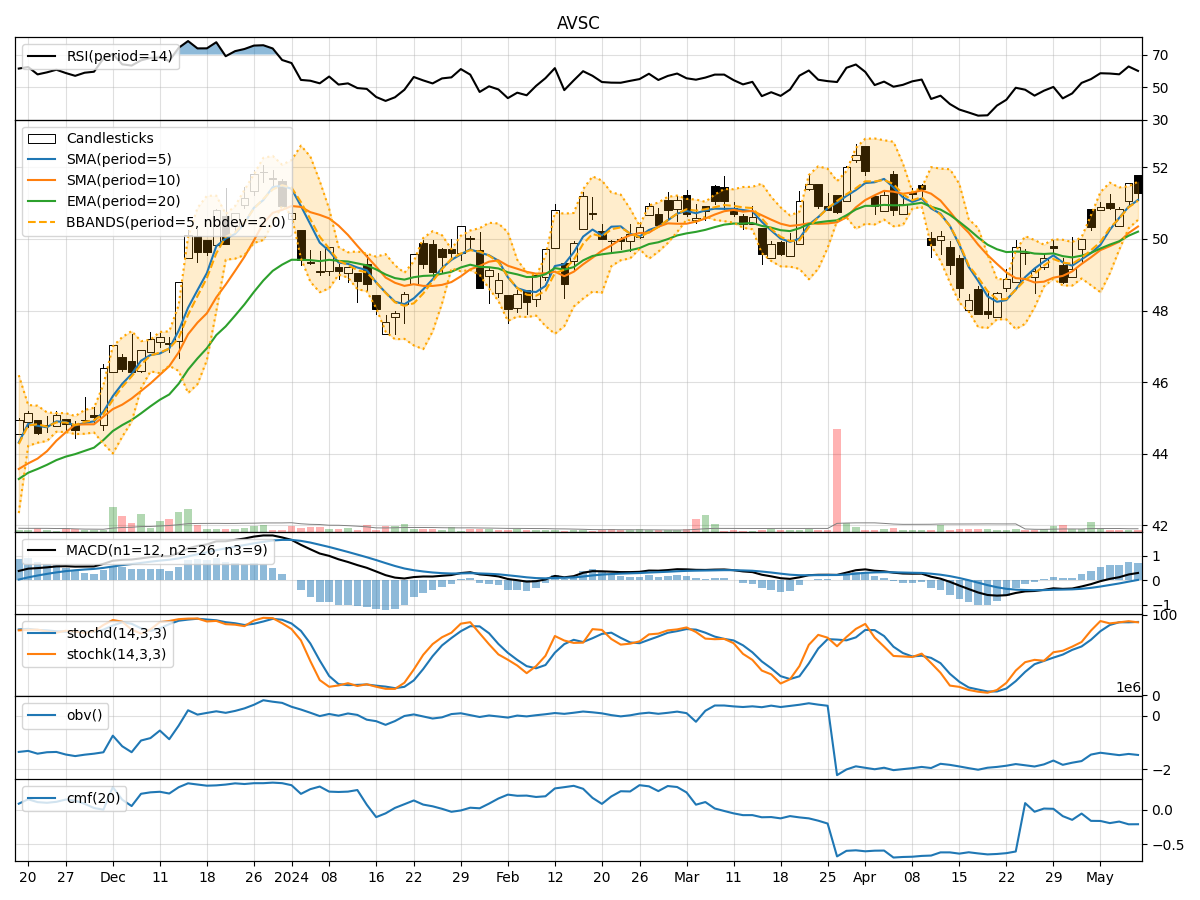
In analyzing the technical indicators for AVSC over the last 5 days, we will delve into the trends, momentum, volatility, and volume aspects to provide a comprehensive outlook on the possible stock price movement. By examining key indicators such as moving averages, MACD, RSI, Stochastic Oscillator, Bollinger Bands, and OBV, we aim to offer valuable insights and predictions for the upcoming days.
Trend Analysis:
- Moving Averages (MA): The 5-day MA has been consistently above the closing prices, indicating a bullish trend.
- MACD: The MACD line has been above the signal line, suggesting a bullish momentum.
- EMA: The EMA has been trending upwards, supporting the bullish sentiment.
Momentum Analysis:
- RSI: The RSI has been fluctuating around the overbought territory, indicating strong buying momentum.
- Stochastic Oscillator: Both %K and %D have been in the overbought zone, signaling a strong bullish momentum.
Volatility Analysis:
- Bollinger Bands: The stock price has been trading within the bands, showing moderate volatility.
- Bollinger %B: The %B indicator has been fluctuating within a reasonable range, indicating stable price movement.
Volume Analysis:
- OBV: The On-Balance Volume has been slightly decreasing, suggesting some distribution.
- CMF: The Chaikin Money Flow has been negative, indicating selling pressure.
Conclusion:
Based on the analysis of the technical indicators, the stock of AVSC is bullish in the short term. The moving averages, MACD, RSI, and Stochastic Oscillator all point towards a continuation of the upward trend. However, the slight decrease in OBV and negative CMF signal some caution regarding the buying pressure. Therefore, it is likely that the stock price will continue its upward movement in the next few days, but investors should monitor the volume closely for any signs of a potential reversal.