Technical Analysis of AVSE 2024-05-10
Overview:
In analyzing the technical indicators for AVSE over the last 5 days, we will delve into the trend, momentum, volatility, and volume indicators to provide a comprehensive outlook on the possible stock price movement in the coming days. By examining these key aspects, we aim to offer valuable insights and recommendations for your investment decisions.
Trend Indicators:
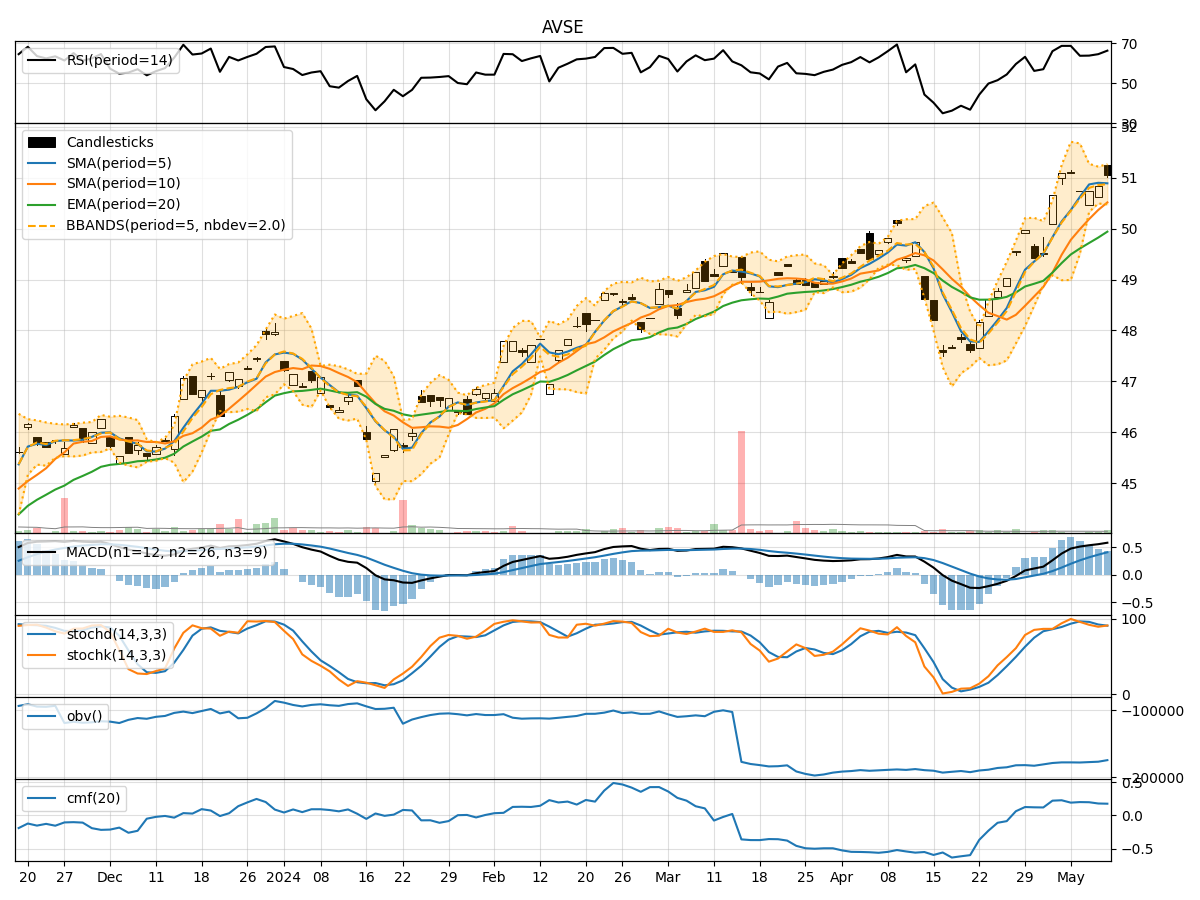
- Moving Averages (MA): The 5-day moving average has been consistently above the closing prices, indicating a bullish trend.
- MACD: The MACD line has been trending upwards, crossing above the signal line, suggesting a bullish momentum.
- EMA: The exponential moving average has been steadily increasing, supporting the bullish trend.
Momentum Indicators:
- RSI: The Relative Strength Index has been in the overbought territory, indicating a strong bullish momentum.
- Stochastic Oscillator: Both %K and %D have been relatively high, signaling a bullish sentiment.
- Williams %R: The indicator has been hovering in the oversold region, suggesting a potential reversal to the upside.
Volatility Indicators:
- Bollinger Bands: The bands have been narrowing, indicating decreasing volatility and a possible consolidation phase.
- Bollinger %B: The %B indicator has been fluctuating around the midline, reflecting a balanced market sentiment.
Volume Indicators:
- On-Balance Volume (OBV): The OBV has been showing a slight decrease, suggesting some distribution of shares.
- Chaikin Money Flow (CMF): The CMF has been positive but declining, indicating a potential weakening of buying pressure.
Key Observations:
- The trend indicators suggest a strong bullish sentiment, supported by moving averages and MACD.
- Momentum indicators point towards an overbought market condition, which may lead to a short-term correction.
- Volatility indicators indicate a potential consolidation phase as the Bollinger Bands tighten.
- Volume indicators show a slight decrease in buying pressure, which could impact the stock price movement.
Conclusion:
Based on the analysis of the technical indicators, the next few days' possible stock price movement for AVSE is likely to experience a short-term correction or consolidation phase. The bullish trend may pause temporarily as the market digests the recent price gains. Traders should exercise caution and consider potential profit-taking opportunities. It is advisable to monitor key support and resistance levels closely to gauge the stock's future direction.