Technical Analysis of AVSF 2024-05-10
Overview:
In analyzing the technical indicators for AVSF over the last 5 days, we will delve into the trend, momentum, volatility, and volume indicators to provide a comprehensive outlook on the possible stock price movement in the coming days. By examining these key aspects, we aim to offer valuable insights and predictions for informed decision-making.
Trend Analysis:
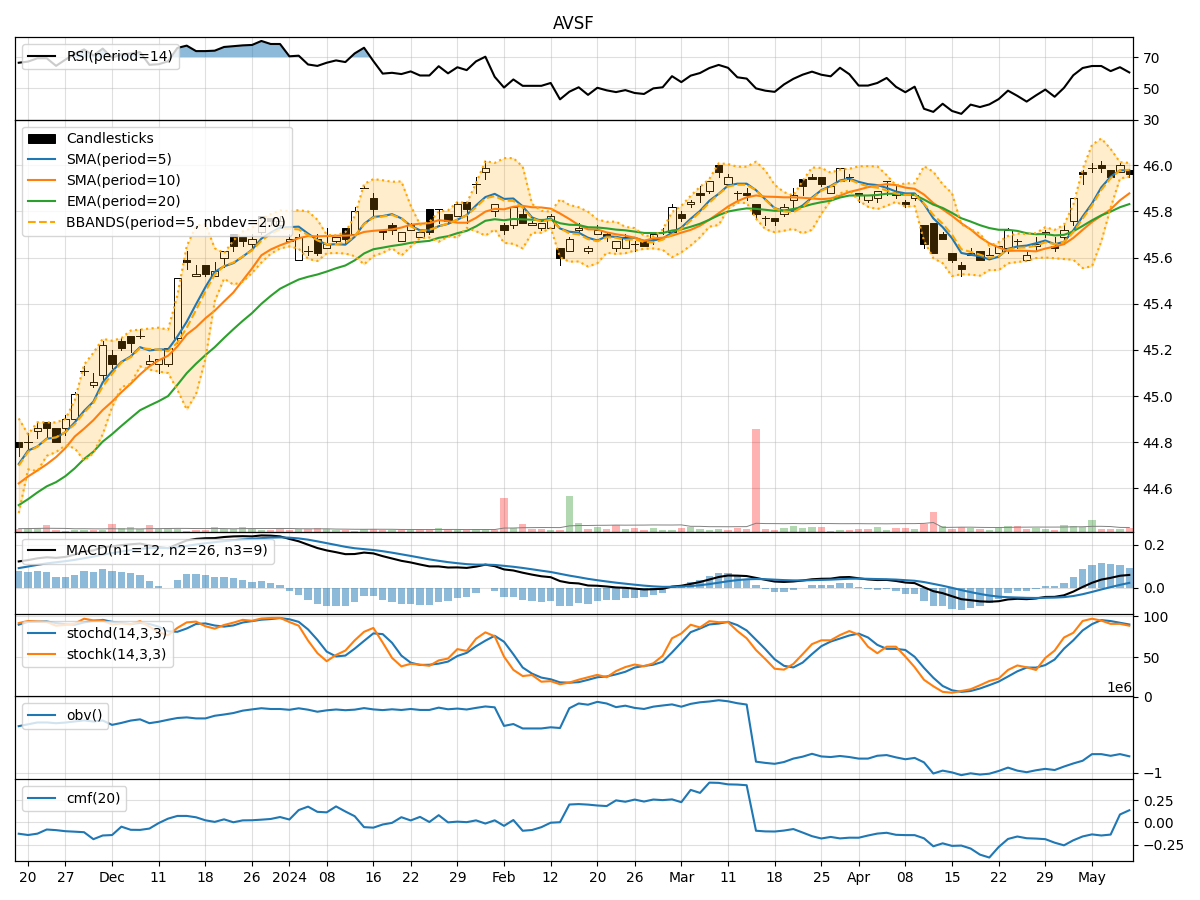
- Moving Averages (MA): The 5-day Moving Average (MA) has been relatively stable around the closing prices, indicating a consistent trend.
- MACD: The Moving Average Convergence Divergence (MACD) shows a positive trend with the MACD line consistently above the signal line.
- EMA: The Exponential Moving Average (EMA) has been gradually increasing, reflecting a bullish sentiment in the short to medium term.
Momentum Analysis:
- RSI: The Relative Strength Index (RSI) has been fluctuating around the mid-level, suggesting a balanced momentum between buying and selling pressure.
- Stochastic Oscillator: Both %K and %D values of the Stochastic Oscillator indicate a slightly oversold condition but are not extreme.
- Williams %R: The Williams %R is hovering near oversold territory, indicating a potential buying opportunity.
Volatility Analysis:
- Bollinger Bands: The Bollinger Bands show a narrowing range, indicating decreasing volatility and a possible period of consolidation.
- Bollinger %B: The %B indicator is approaching the lower band, suggesting a potential bounce back in prices.
Volume Analysis:
- On-Balance Volume (OBV): The OBV has been fluctuating, indicating indecision among investors regarding the stock.
- Chaikin Money Flow (CMF): The CMF has been negative, reflecting a lack of buying pressure in the market.
Key Observations:
- The trend indicators suggest a bullish sentiment in the short to medium term.
- Momentum indicators show a neutral stance with a slight inclination towards oversold conditions.
- Volatility indicators point towards a period of consolidation and decreasing price fluctuations.
- Volume indicators indicate a lack of strong buying interest in the stock.
Conclusion:
Based on the analysis of the technical indicators, the next few days for AVSF are likely to see sideways movement with a slight bullish bias. Investors may expect the stock price to consolidate within a narrow range before potentially resuming an upward trend. It is advisable to closely monitor key support and resistance levels for potential entry or exit points.