Technical Analysis of AVSU 2024-05-10
Overview:
In analyzing the technical indicators for AVSU over the last 5 days, we will delve into the trend, momentum, volatility, and volume indicators to provide a comprehensive outlook on the possible stock price movement. By examining these key aspects, we aim to offer valuable insights and predictions for the upcoming trading days.
Trend Indicators:
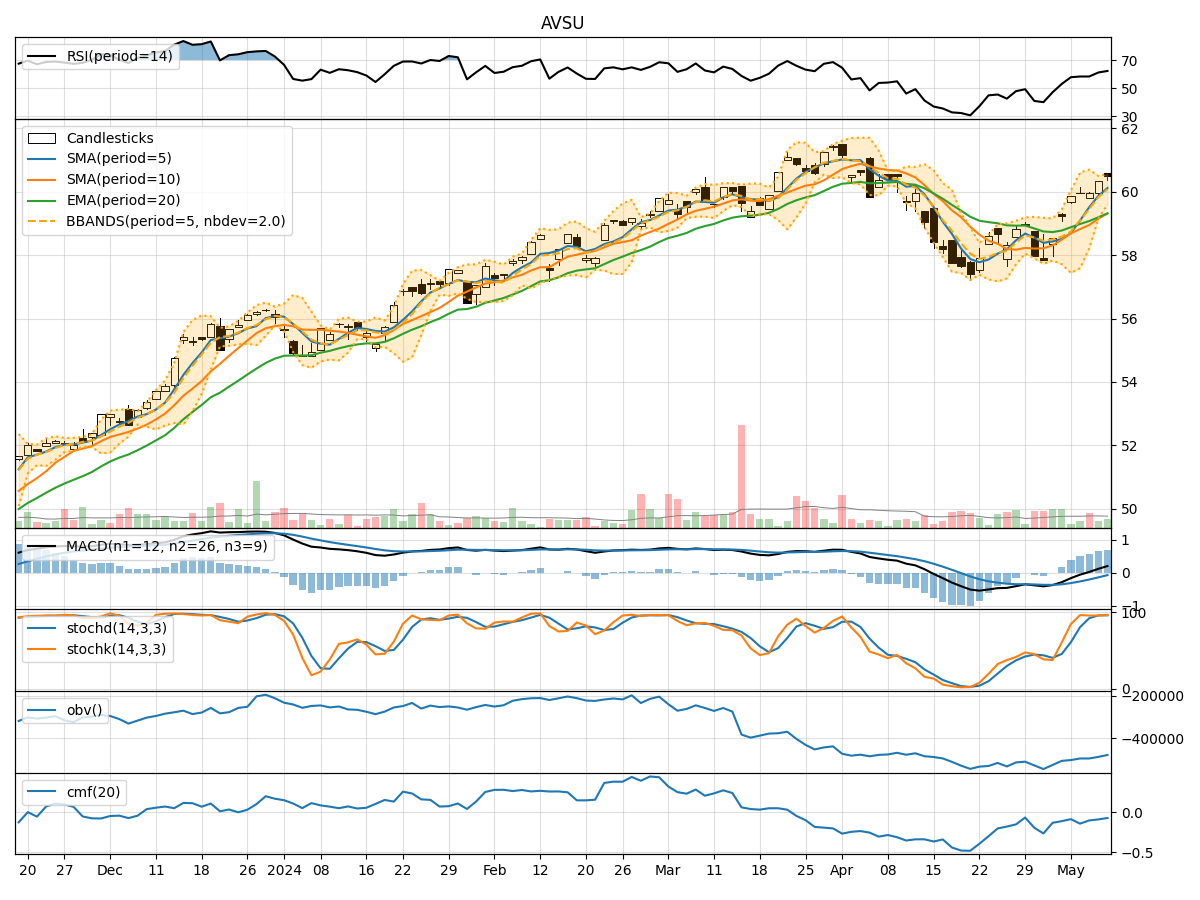
- Moving Averages (MA): The 5-day MA has been consistently above the 10-day SMA, indicating a short-term bullish trend. The EMA(20) has shown a gradual uptrend, suggesting positive momentum in the stock price.
- MACD: The MACD line has been above the signal line for the past 5 days, indicating a bullish trend. The MACD histogram has been steadily increasing, reflecting strengthening bullish momentum.
Momentum Indicators:
- RSI: The RSI has been in the overbought territory, indicating a strong bullish momentum in the stock. However, caution should be exercised as extremely high RSI levels may signal a potential reversal.
- Stochastic Oscillator: Both %K and %D have been in the overbought zone, suggesting a strong upward momentum. Traders should be mindful of a possible pullback if the indicators remain in the overbought region for an extended period.
Volatility Indicators:
- Bollinger Bands: The stock price has been trading within the upper Bollinger Band, indicating an overbought condition. A potential reversal or consolidation phase may be on the horizon.
- Bollinger %B: The %B indicator has been above 0.8, signaling an overbought condition. Traders should be cautious as this may precede a price correction.
Volume Indicators:
- On-Balance Volume (OBV): The OBV has been declining over the past 5 days, suggesting a divergence between volume and price movement. This could indicate weakening buying pressure.
- Chaikin Money Flow (CMF): The CMF has been negative, indicating a lack of buying pressure over the 20-day period. This aligns with the declining OBV and may signal a potential reversal in price.
Conclusion:
Based on the analysis of the technical indicators, the stock of AVSU is currently exhibiting overbought conditions across various indicators, including RSI, Stochastic Oscillator, and Bollinger Bands. The bullish momentum is strong, as indicated by the moving averages and MACD, but caution is advised due to the potential for a reversal or consolidation in the near future. The declining OBV and negative CMF suggest weakening buying pressure, which could lead to a pullback in the stock price.
In conclusion, while the short-term trend remains bullish, traders should be prepared for a possible correction or consolidation phase in the coming days. It is advisable to closely monitor key support and resistance levels, as well as the behavior of the momentum and volume indicators, to make informed trading decisions.