Technical Analysis of AWEG 2024-05-10
Overview:
In analyzing the technical indicators for AWEG over the last 5 days, we will delve into the trend, momentum, volatility, and volume indicators to provide a comprehensive outlook on the possible stock price movement in the coming days. By examining these key aspects, we aim to offer valuable insights and predictions to guide investment decisions.
Trend Analysis:
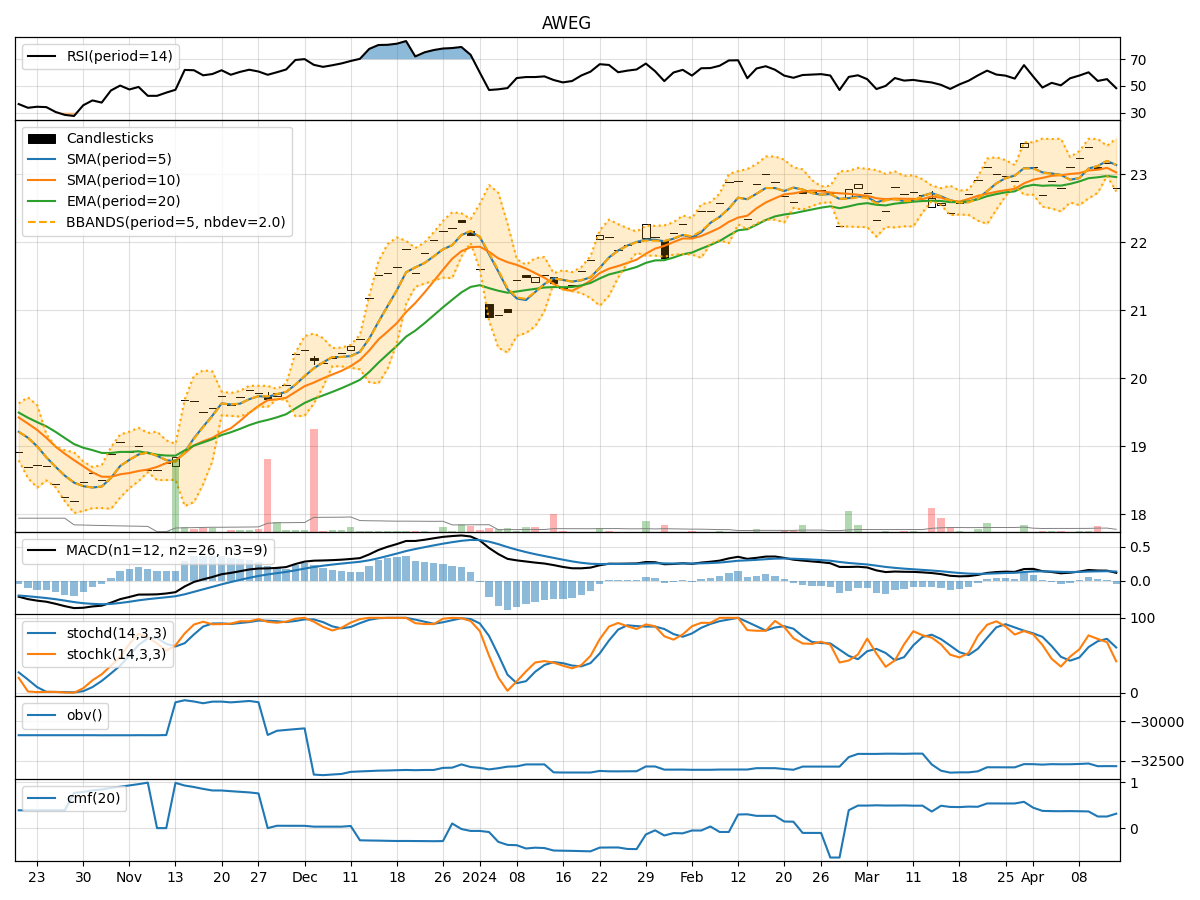
- Moving Averages (MA): The 5-day Moving Average (MA) has been consistently above the Simple Moving Average (SMA) and Exponential Moving Average (EMA), indicating a bullish trend.
- MACD: The MACD line has been consistently above the signal line, suggesting a positive momentum in the stock price.
Momentum Analysis:
- RSI: The Relative Strength Index (RSI) has been fluctuating around the neutral zone, indicating a balanced momentum in the stock.
- Stochastic Oscillator: The Stochastic indicators show a slight decline but still remain in the overbought territory, suggesting a potential reversal in the short term.
Volatility Analysis:
- Bollinger Bands (BB): The Bollinger Bands have been narrowing, indicating decreasing volatility in the stock price.
Volume Analysis:
- On-Balance Volume (OBV): The OBV has shown a positive trend, indicating accumulation of the stock by investors.
- Chaikin Money Flow (CMF): The CMF has been positive, suggesting strong buying pressure in the stock.
Key Observations:
- The trend indicators suggest a bullish sentiment in the stock price.
- Momentum indicators show a neutral to slightly bearish outlook in the short term.
- Volatility has been decreasing, indicating a potential consolidation phase.
- Volume indicators point towards accumulation and strong buying pressure.
Conclusion:
Based on the analysis of the technical indicators, the next few days' possible stock price movement for AWEG is likely to be sideways with a slight bullish bias. The stock may experience a period of consolidation before potentially resuming its upward trend. Investors should monitor the momentum indicators closely for any signs of a reversal and consider the decreasing volatility as a signal of stability in the stock price. Overall, a cautious approach with a focus on key support and resistance levels is recommended in the current market environment.