Technical Analysis of AZTD 2024-05-10
Overview:
In analyzing the technical indicators for AZTD over the last 5 days, we will delve into the trend, momentum, volatility, and volume indicators to provide a comprehensive outlook on the possible stock price movement in the coming days. By examining these key aspects, we aim to offer valuable insights and predictions for potential investors.
Trend Analysis:
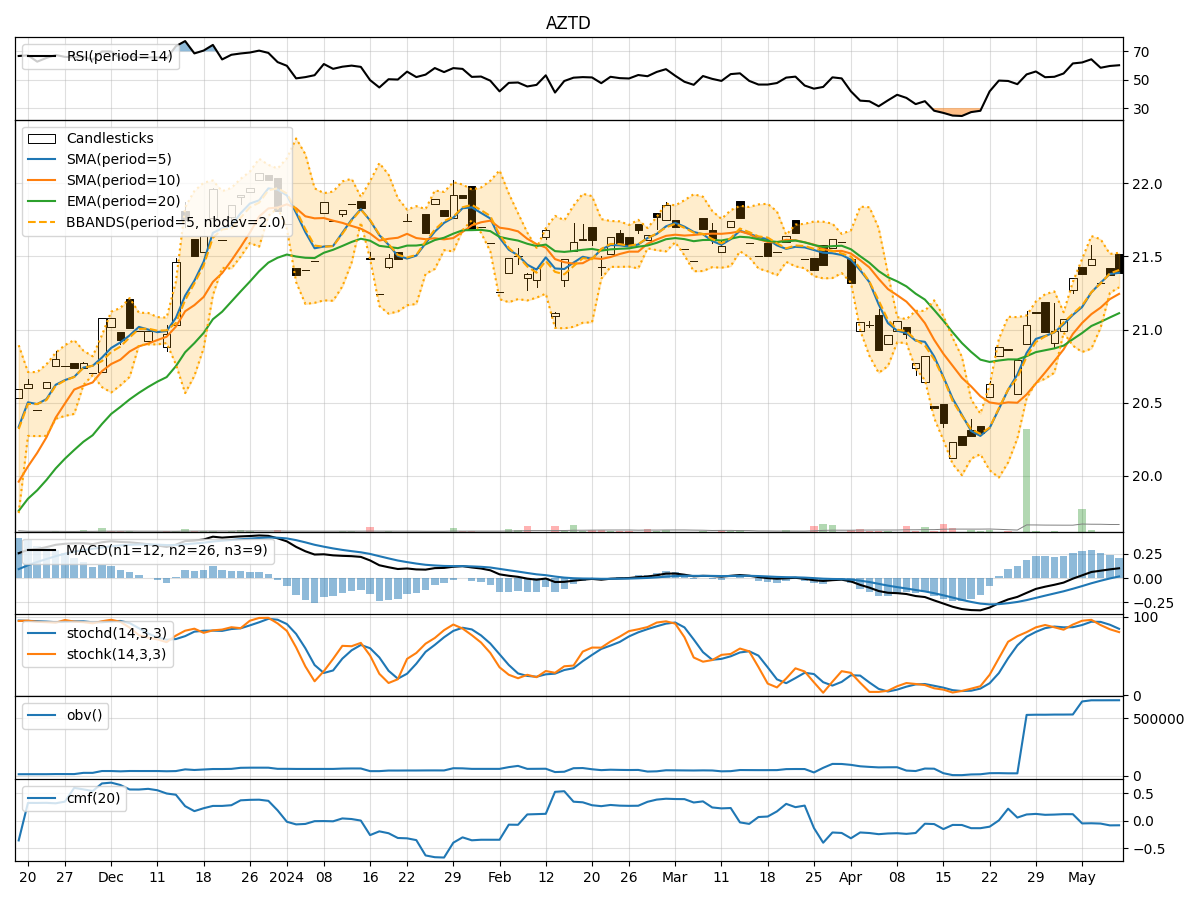
- Moving Averages (MA): The 5-day Moving Average (MA) has been consistently above the Simple Moving Average (SMA) and Exponential Moving Average (EMA), indicating a bullish trend.
- MACD: The MACD line has been above the signal line, with the MACD Histogram showing positive values, suggesting a bullish momentum.
Momentum Analysis:
- RSI: The Relative Strength Index (RSI) has been hovering around 60-65, indicating a neutral to slightly bullish momentum.
- Stochastic Oscillator: Both %K and %D have been declining but remain in the overbought territory, signaling a potential reversal or consolidation phase.
Volatility Analysis:
- Bollinger Bands (BB): The stock price has been trading within the Bollinger Bands, with the bands narrowing, suggesting decreasing volatility.
- Bollinger %B: The %B indicator has been fluctuating around 0.5, indicating the stock is trading near the middle band.
Volume Analysis:
- On-Balance Volume (OBV): The OBV has been relatively flat, indicating a balance between buying and selling pressure.
- Chaikin Money Flow (CMF): The CMF has been negative, suggesting a slight distribution phase.
Key Observations:
- The trend indicators point towards a bullish sentiment, supported by the moving averages and MACD.
- Momentum indicators show a neutral to slightly bullish stance, with the RSI indicating potential room for further upside.
- Volatility has been decreasing, indicating a possible period of consolidation or sideways movement.
- Volume indicators suggest a balance between buying and selling pressure, with a slight inclination towards distribution.
Conclusion:
Based on the analysis of the technical indicators, the next few days for AZTD could see sideways movement or consolidation as the stock price may trade within a narrow range. The bullish trend and momentum indicators suggest a potential for upward movement in the medium term, but the decreasing volatility and neutral volume indicators imply a period of stability in the short term. Investors should monitor key support and resistance levels for potential breakout opportunities.