Technical Analysis of BABX 2024-05-10
Overview:
In analyzing the technical indicators for BABX stock over the last 5 days, we will delve into the trends, momentum, volatility, and volume indicators to provide a comprehensive outlook on the possible future stock price movement. By examining these key indicators, we aim to offer valuable insights and recommendations for potential investors.
Trend Indicators:
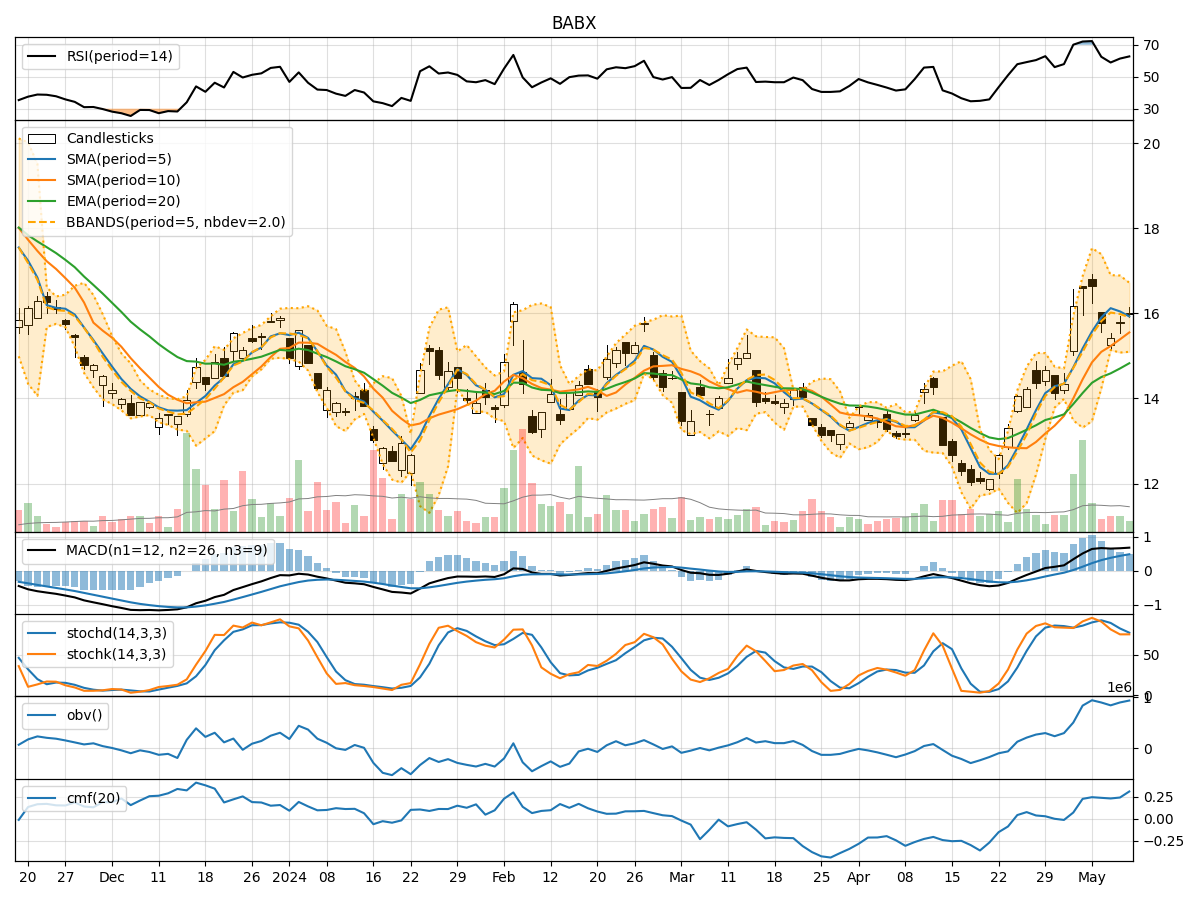
- Moving Averages (MA): The 5-day moving average has been consistently above the longer-term moving averages (SMA and EMA), indicating a short-term uptrend in the stock price.
- MACD: The MACD line has been consistently above the signal line, with both lines showing an upward trend. This suggests bullish momentum in the stock.
- MACD Histogram: The MACD histogram has been increasing over the past 5 days, indicating strengthening bullish momentum.
Key Observation: The trend indicators suggest a bullish outlook for BABX stock in the short term.
Momentum Indicators:
- RSI: The Relative Strength Index (RSI) has been fluctuating in the overbought territory but has not shown extreme levels, indicating potential room for further upside.
- Stochastic Oscillator: Both %K and %D lines of the Stochastic Oscillator have been in the overbought zone, suggesting a strong bullish momentum.
- Williams %R: The Williams %R indicator has been consistently in the oversold territory, indicating a potential reversal to the upside.
Key Observation: Momentum indicators signal a strong bullish momentum for BABX stock.
Volatility Indicators:
- Bollinger Bands: The stock price has been trading within the Bollinger Bands, with the bands widening slightly over the past few days, indicating increased volatility.
- Bollinger %B: The %B indicator has been fluctuating within the bands, suggesting no extreme overbought or oversold conditions.
Key Observation: Volatility indicators point towards increased volatility but do not provide a clear directional bias.
Volume Indicators:
- On-Balance Volume (OBV): The OBV indicator has been showing a slight increase over the last 5 days, indicating accumulation of the stock.
- Chaikin Money Flow (CMF): The CMF has been positive and increasing, reflecting buying pressure in the stock.
Key Observation: Volume indicators suggest a positive sentiment among investors towards BABX stock.
Conclusion:
Based on the analysis of the technical indicators, the overall outlook for BABX stock is bullish in the short term. The trend indicators, momentum indicators, and volume indicators all point towards a potential continuation of the current uptrend. However, the increased volatility indicated by the volatility indicators suggests that there may be some fluctuations in the stock price.
Recommendation: Considering the bullish momentum and positive volume accumulation, investors may consider buying BABX stock for potential short-term gains. It is important to monitor the stock closely for any signs of reversal or increased volatility.