Technical Analysis of BAMA 2024-05-10
Overview:
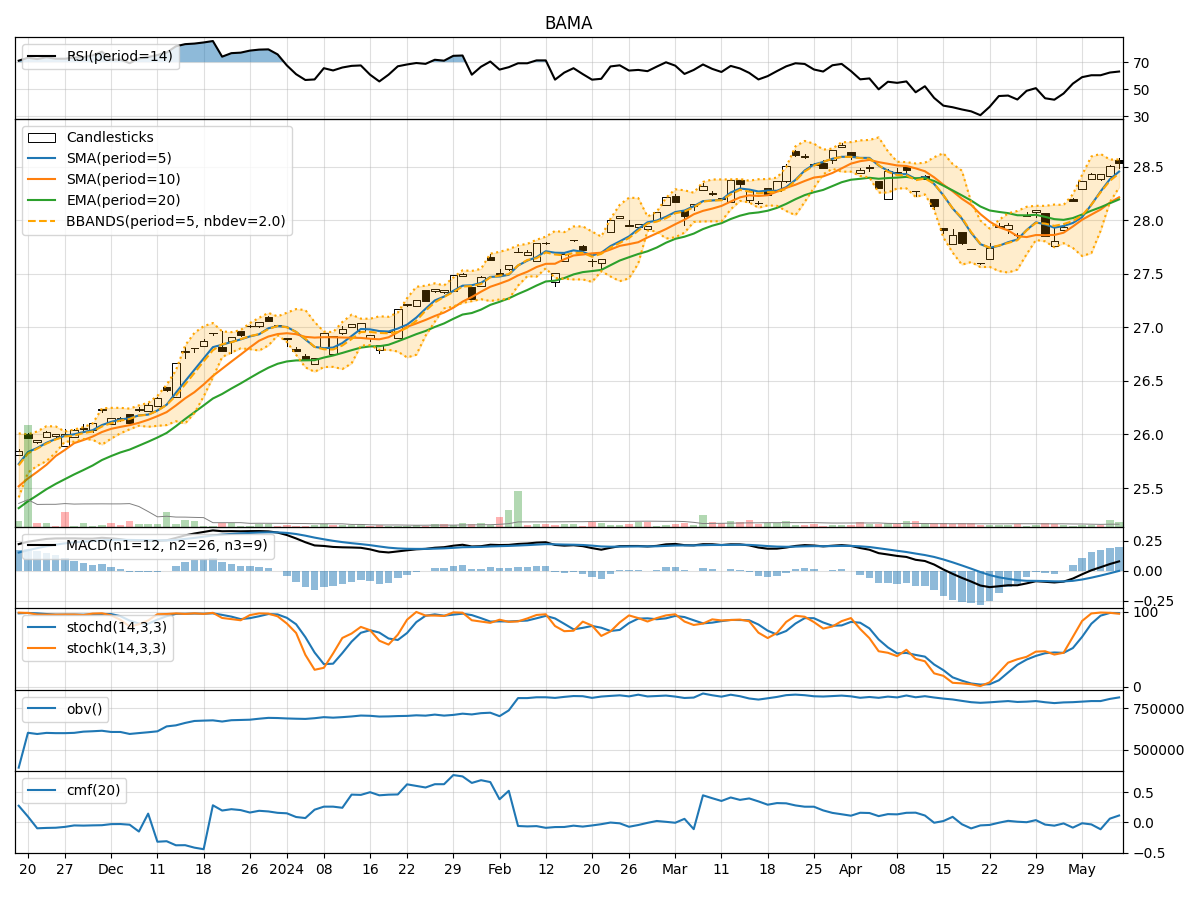
In analyzing the technical indicators for BAMA stock over the last 5 days, we will delve into the trend, momentum, volatility, and volume indicators to provide a comprehensive outlook on the possible stock price movement in the coming days. By examining these key indicators, we aim to offer valuable insights and recommendations for potential investors.
Trend Analysis:
- Moving Averages (MA): The 5-day Moving Average (MA) has been consistently above the Simple Moving Average (SMA) and Exponential Moving Average (EMA), indicating a bullish trend.
- MACD: The MACD line has been consistently above the signal line, with both lines showing an upward trend, suggesting bullish momentum.
- RSI: The Relative Strength Index (RSI) has been increasing and is currently in the overbought territory, indicating strong bullish momentum.
Momentum Analysis:
- Stochastic Oscillator: Both %K and %D lines of the Stochastic Oscillator have been in the overbought zone, suggesting a strong bullish momentum.
- Williams %R: The Williams %R indicator has been consistently in the oversold territory, indicating a strong bullish sentiment.
Volatility Analysis:
- Bollinger Bands (BB): The stock price has been trading within the upper Bollinger Band, indicating high volatility and a potential continuation of the bullish trend.
- Bollinger %B: The Bollinger %B is above 0.8, suggesting that the stock is trading near the upper band, indicating a bullish sentiment.
Volume Analysis:
- On-Balance Volume (OBV): The OBV has been fluctuating but has shown a recent uptick, indicating buying pressure and potential bullish sentiment.
- Chaikin Money Flow (CMF): The CMF has been positive over the last few days, indicating that money is flowing into the stock, supporting the bullish outlook.
Conclusion:
Based on the analysis of the technical indicators, it is evident that BAMA stock is currently in a strong bullish trend. The momentum indicators, volatility indicators, and volume indicators all point towards a continuation of the bullish sentiment in the coming days. Therefore, the next few days are likely to see the stock price of BAMA moving upward. Investors may consider taking advantage of this bullish trend to potentially capitalize on the expected price appreciation.