Technical Analysis of BAMD 2024-05-10
Overview:
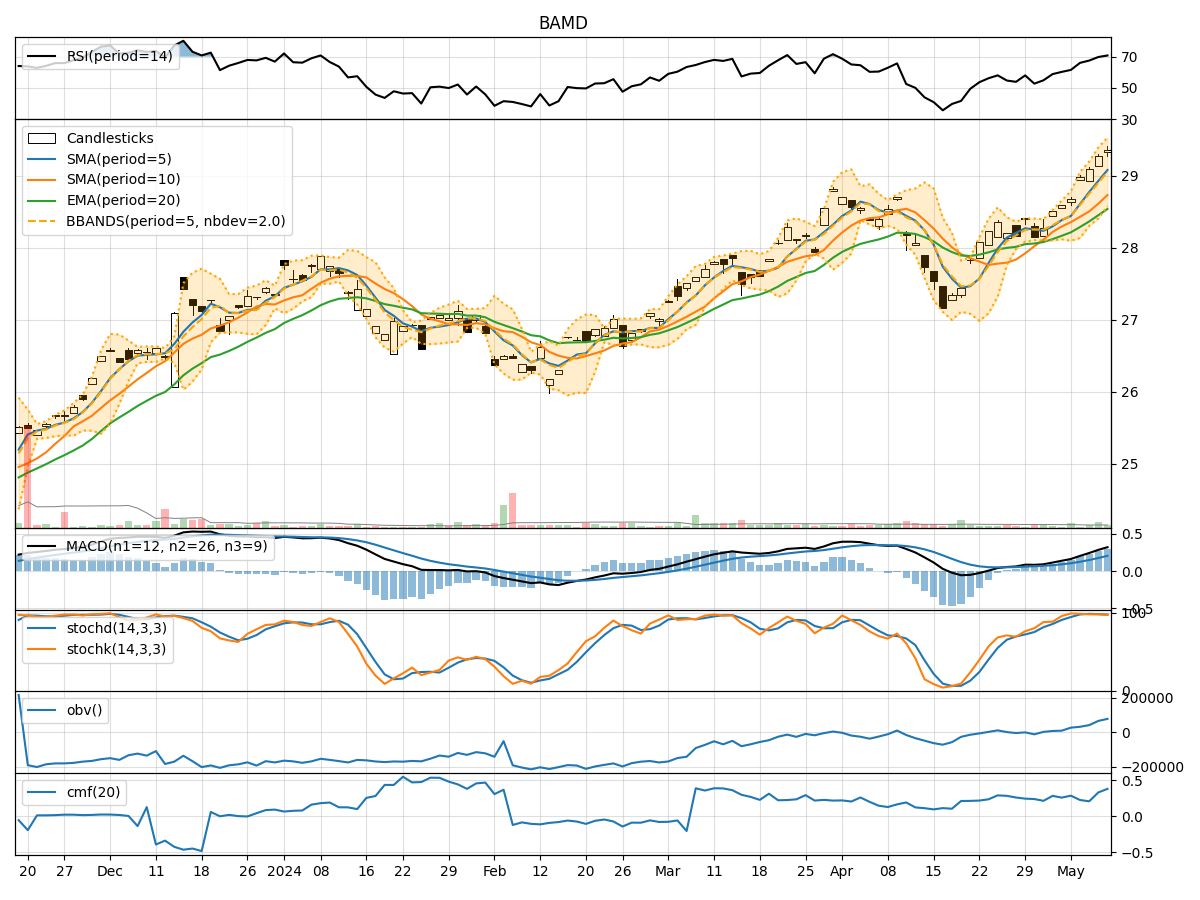
In analyzing the technical indicators for BAMD over the last 5 days, we will delve into the trend, momentum, volatility, and volume indicators to provide a comprehensive outlook on the possible stock price movement in the coming days.
Trend Indicators:
- Moving Averages (MA): The 5-day MA has been consistently above the closing prices, indicating a short-term uptrend.
- MACD: The MACD line has been above the signal line, suggesting bullish momentum.
- EMA: The exponential moving average has been trending upwards, supporting the bullish sentiment.
Momentum Indicators:
- RSI: The RSI has been in the overbought territory, indicating strong buying momentum.
- Stochastic Oscillator: Both %K and %D have been high, signaling potential overbought conditions.
- Williams %R: The indicator has been in the oversold region, suggesting a possible reversal.
Volatility Indicators:
- Bollinger Bands: The stock price has been trading within the bands, indicating moderate volatility.
- Bollinger %B: The %B indicator has been fluctuating around the midline, reflecting consolidation.
Volume Indicators:
- On-Balance Volume (OBV): The OBV has been steadily increasing, showing accumulation by investors.
- Chaikin Money Flow (CMF): The CMF has been positive, indicating buying pressure.
Key Observations:
- The trend indicators suggest a bullish sentiment with moving averages and MACD supporting an upward trajectory.
- Momentum indicators show mixed signals with RSI in overbought territory and Williams %R in oversold, indicating potential for a reversal.
- Volatility indicators point towards a period of consolidation with Bollinger Bands narrowing.
- Volume indicators reflect positive accumulation and buying pressure in the stock.
Conclusion:
Based on the analysis of technical indicators, the stock of BAMD is likely to experience further upward movement in the coming days. The bullish trend supported by moving averages and MACD, coupled with positive volume indicators, suggests continued buying interest. However, caution is advised as momentum indicators show signs of potential reversal, and volatility remains moderate. Traders should monitor price action closely for any signs of a shift in market sentiment.