Technical Analysis of BAMG 2024-05-10
Overview:
In analyzing the technical indicators for BAMG over the last 5 days, we will delve into the trend, momentum, volatility, and volume indicators to provide a comprehensive outlook on the possible stock price movement in the coming days. By examining these key aspects, we aim to offer valuable insights and recommendations for potential investors.
Trend Analysis:
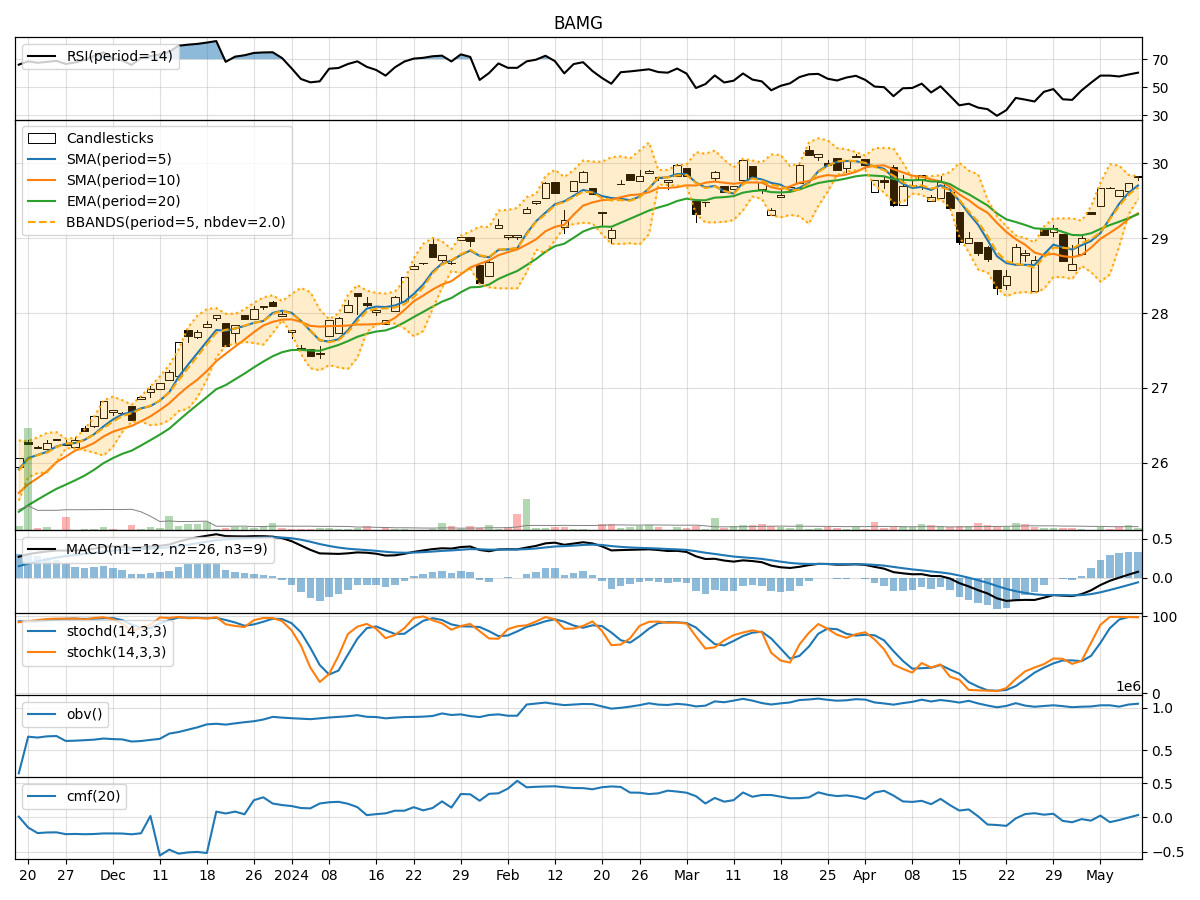
- Moving Averages (MA): The 5-day Moving Average (MA) has been consistently above the Simple Moving Average (SMA) and Exponential Moving Average (EMA), indicating a bullish trend.
- MACD: The MACD line has been consistently above the signal line, with both lines showing an upward trend, suggesting bullish momentum.
- MACD Histogram: The MACD Histogram has been increasing over the past 5 days, indicating strengthening bullish momentum.
Momentum Analysis:
- RSI: The Relative Strength Index (RSI) has been gradually increasing and is currently in the overbought territory, suggesting a strong bullish momentum.
- Stochastic Oscillator: Both %K and %D lines of the Stochastic Oscillator are in the overbought zone, indicating a strong bullish momentum.
- Williams %R: The Williams %R is in the oversold region, suggesting a potential reversal in the bullish momentum.
Volatility Analysis:
- Bollinger Bands: The stock price has been trading within the Bollinger Bands, with the bands narrowing over the last 5 days, indicating decreasing volatility.
- Bollinger %B: The %B indicator is above 0.5, suggesting that the stock price is trading above the middle band, indicating a bullish trend.
Volume Analysis:
- On-Balance Volume (OBV): The OBV has shown mixed signals, with fluctuations in volume indicating indecision among investors.
- Chaikin Money Flow (CMF): The CMF has been fluctuating around the zero line, indicating a balance between buying and selling pressure.
Conclusion:
Based on the analysis of the technical indicators, the stock of BAMG is exhibiting strong bullish momentum in the short term. The trend indicators, momentum oscillators, and volatility analysis all point towards a continuation of the upward trend. However, the mixed signals in volume indicators suggest a potential consolidation phase in the near future.
Recommendation:
- Short Term: The stock is likely to continue its upward movement in the next few days, with potential for further gains.
- Long Term: Investors should monitor the volume indicators closely for any signs of a trend reversal or consolidation phase.
- Risk Management: Consider setting stop-loss orders to protect profits in case of a sudden reversal in the stock price.
Key Conclusion:
The technical analysis indicates a strong bullish outlook for BAMG in the short term, with the potential for further upside movement. Investors should remain vigilant and adjust their strategies based on evolving market conditions.