Technical Analysis of BAMO 2024-05-10
Overview:
In analyzing the technical indicators for BAMO stock over the last 5 days, we will delve into the trend, momentum, volatility, and volume indicators to provide a comprehensive outlook on the possible stock price movement in the coming days. By examining these key indicators, we aim to offer valuable insights and predictions for potential investors.
Trend Indicators:
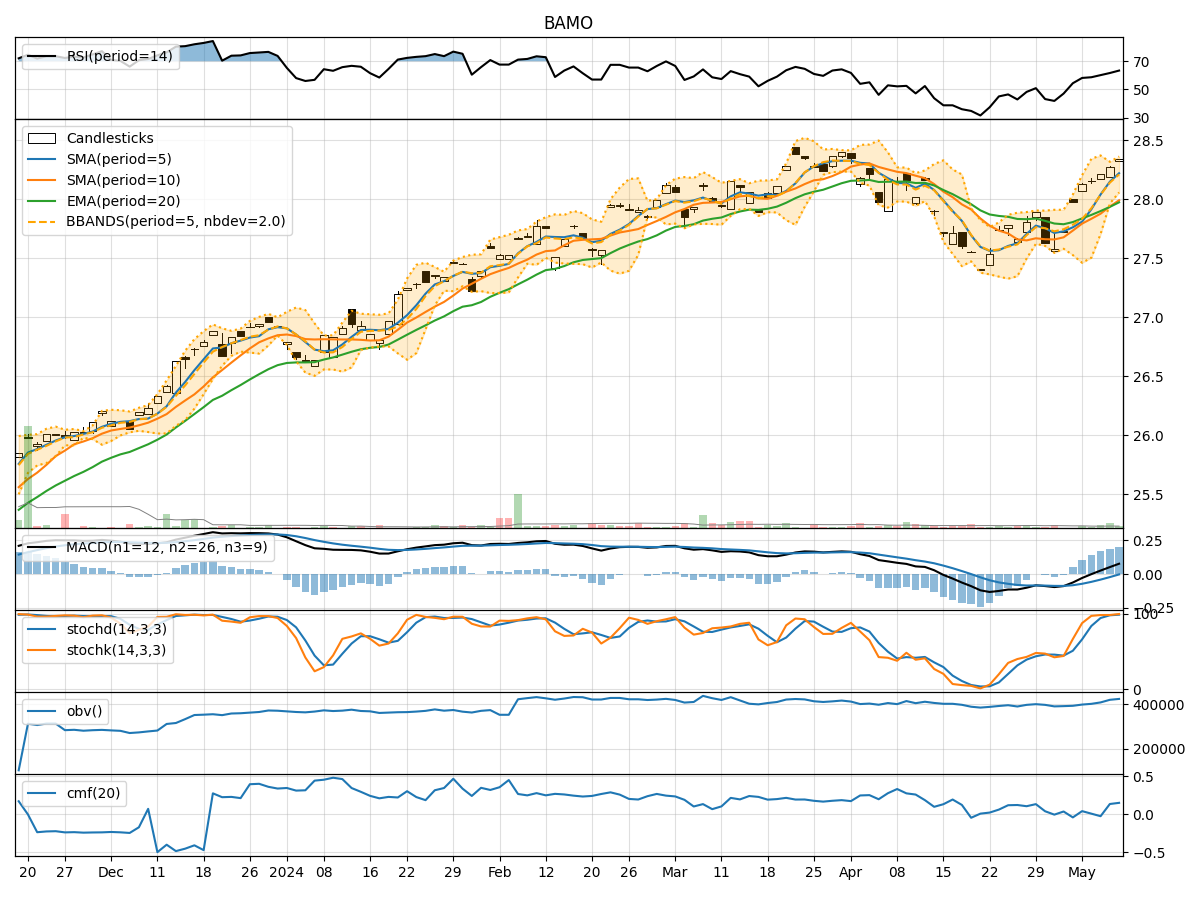
- Moving Averages (MA): The 5-day Moving Average has been consistently rising, indicating a bullish trend in the short term.
- MACD: The MACD line has been increasing, crossing above the signal line, suggesting a bullish momentum.
- RSI: The Relative Strength Index has been trending upwards, indicating increasing buying pressure.
Key Observation: The trend indicators suggest a bullish sentiment in the stock price movement.
Momentum Indicators:
- Stochastic Oscillator: Both %K and %D have been in the overbought territory, signaling a strong bullish momentum.
- Williams %R: The indicator has been hovering in the oversold region, indicating a potential reversal to the upside.
Key Observation: Momentum indicators reflect a strong bullish momentum in the stock.
Volatility Indicators:
- Bollinger Bands: The stock price has been trading within the bands, with the bands narrowing, suggesting a period of consolidation.
- Bollinger %B: The %B indicator is above 0.5, indicating a bullish trend.
Key Observation: Volatility indicators point towards a period of consolidation with a slight bullish bias.
Volume Indicators:
- On-Balance Volume (OBV): The OBV has shown mixed signals with fluctuations, indicating indecision among investors.
- Chaikin Money Flow (CMF): The CMF has been positive, suggesting buying pressure in the stock.
Key Observation: Volume indicators suggest a mixed sentiment among investors, with some buying interest present.
Conclusion:
Based on the analysis of the technical indicators, the next few days' possible stock price movement for BAMO is likely to be upward with a bullish bias. The trend indicators, momentum indicators, and volatility indicators all point towards a bullish sentiment in the stock price movement. However, the mixed signals from volume indicators indicate some indecision among investors, which could lead to fluctuations in the short term.
Overall Assessment: The stock is likely to experience an upward movement in the coming days, with potential for further gains based on the strong bullish momentum and positive trend indicators. Investors may consider entering long positions to capitalize on the expected price appreciation.