Technical Analysis of BAMU 2024-05-10
Overview:
In analyzing the technical indicators for BAMU stock over the last 5 days, we will delve into the trend, momentum, volatility, and volume indicators to provide a comprehensive outlook on the possible stock price movement in the coming days. By examining these key aspects, we aim to offer valuable insights and predictions to guide your investment decisions.
Trend Analysis:
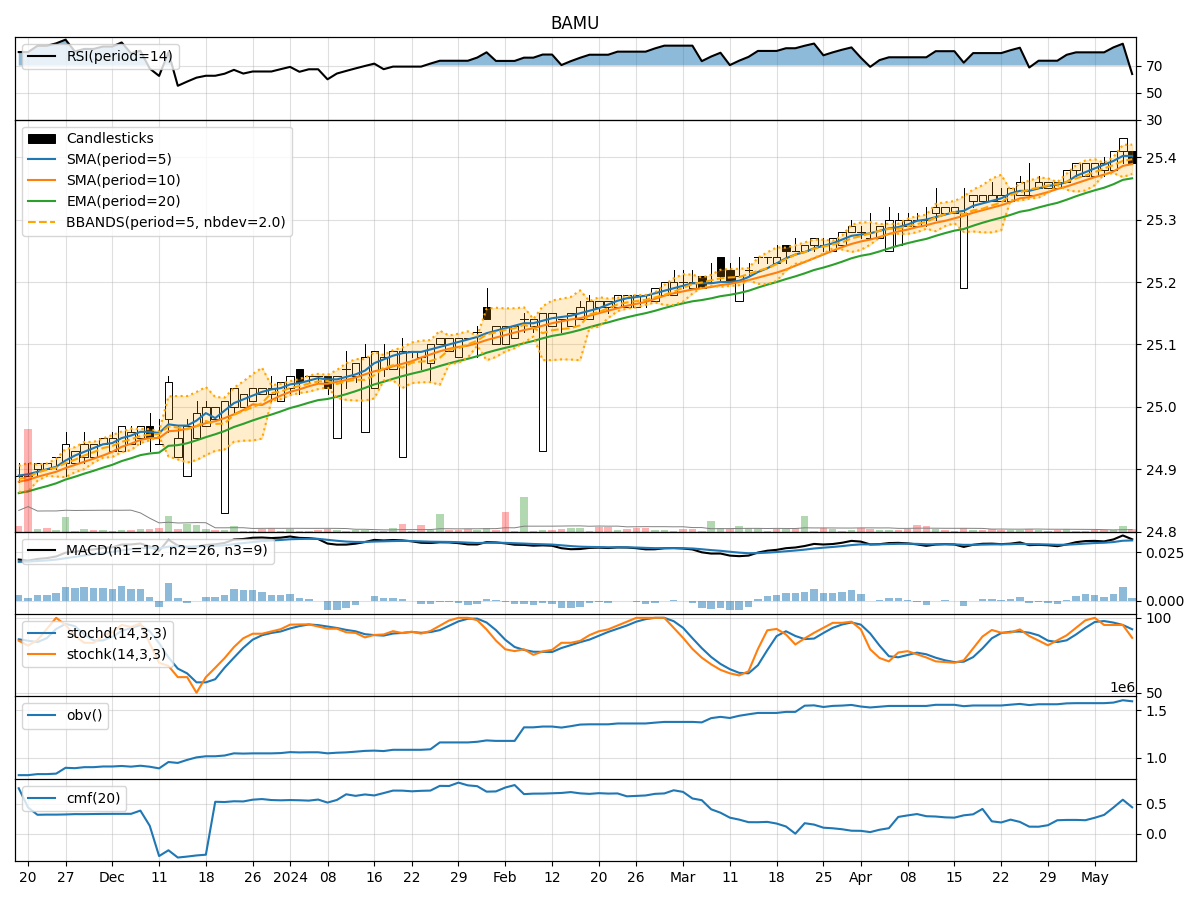
- Moving Averages (MA): The 5-day Moving Average (MA) has been relatively stable around the current stock price, indicating a consistent trend.
- MACD: The Moving Average Convergence Divergence (MACD) shows a positive trend with the MACD line consistently above the signal line, suggesting bullish momentum.
Key Observation: The trend indicators suggest a bullish sentiment in the stock price movement.
Momentum Analysis:
- RSI: The Relative Strength Index (RSI) has been fluctuating but remains in the overbought territory, indicating strong buying momentum.
- Stochastic Oscillator: Both %K and %D lines of the Stochastic Oscillator are in the overbought zone, signaling a potential reversal.
Key Observation: Momentum indicators point towards a potential reversal due to overbought conditions.
Volatility Analysis:
- Bollinger Bands (BB): The Bollinger Bands are relatively narrow, indicating low volatility in the stock price.
Key Observation: Volatility indicators suggest a consolidation phase with limited price fluctuations.
Volume Analysis:
- On-Balance Volume (OBV): The OBV has shown an overall increase, indicating accumulation by investors.
- Chaikin Money Flow (CMF): The CMF has been positive, reflecting buying pressure in the stock.
Key Observation: Volume indicators support the bullish sentiment with increasing accumulation and buying pressure.
Conclusion:
Based on the analysis of trend, momentum, volatility, and volume indicators, the overall outlook for BAMU stock suggests a bullish bias in the short term. The trend indicators indicate a positive momentum, supported by increasing buying pressure and accumulation as seen in the volume indicators. However, the overbought conditions in the momentum indicators signal a potential reversal or correction in the stock price.
Recommendation:
Considering the current technical analysis, it is advisable to exercise caution and closely monitor the stock price movement for any signs of a reversal. Investors may consider taking profits if the stock price continues to rise, while also being prepared for a possible correction in the near future. It is essential to have a risk management strategy in place to protect gains and minimize losses in case of a market downturn.
Disclaimer:
Please note that technical analysis is not a guaranteed predictor of future price movements, and other fundamental factors can influence stock prices. It is crucial to conduct thorough research and consider multiple indicators before making any investment decisions. Consulting with a financial advisor is recommended for personalized investment advice tailored to your specific financial goals and risk tolerance level.