Technical Analysis of BAMV 2024-05-10
Overview:
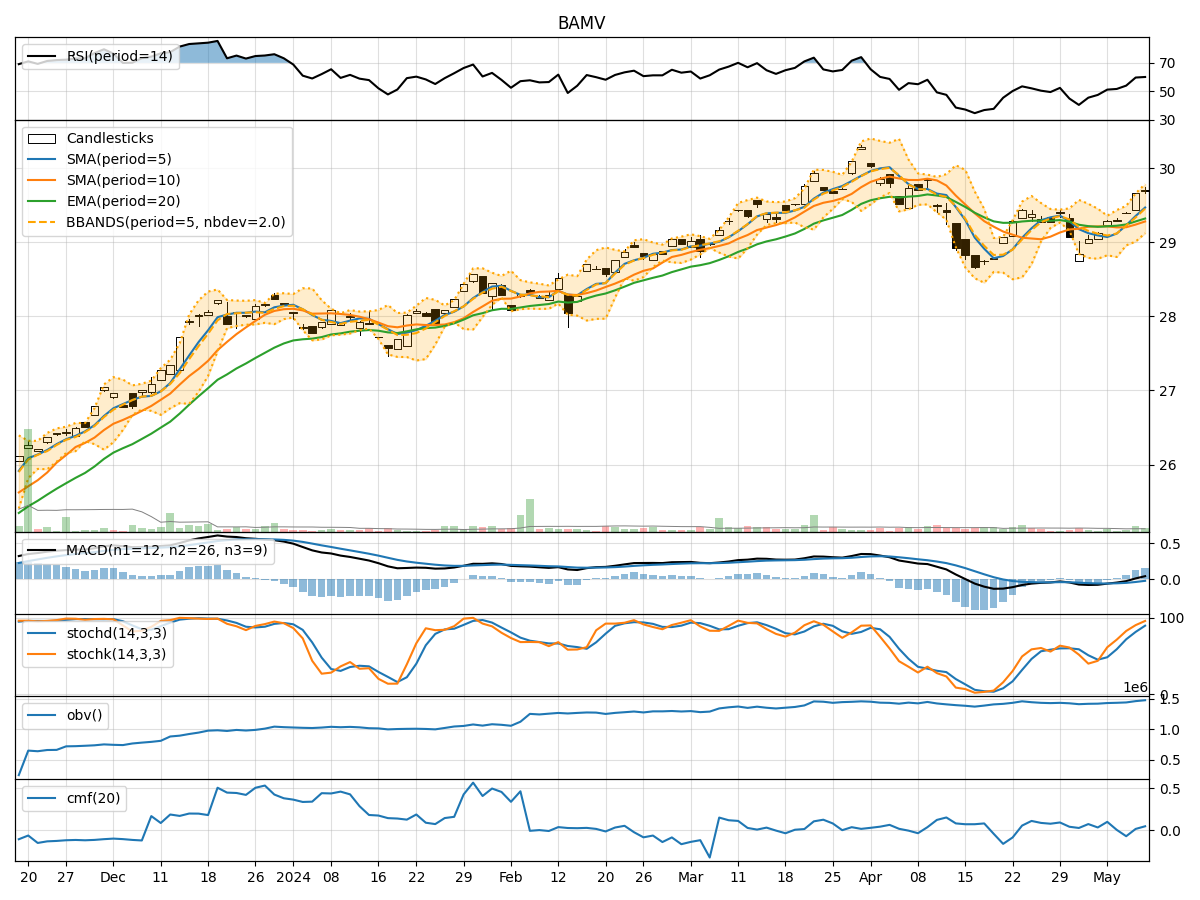
In analyzing the technical indicators for BAMV over the last 5 days, we will delve into the trend, momentum, volatility, and volume indicators to provide a comprehensive outlook on the possible stock price movement. By examining these key aspects, we aim to offer valuable insights and predictions for the upcoming days.
Trend Indicators:
- Moving Averages (MA): The 5-day moving average has been consistently above the closing prices, indicating a short-term uptrend.
- MACD: The MACD line has been trending upwards, with the MACD histogram showing positive values, suggesting bullish momentum.
- EMA: The exponential moving average has been steadily increasing, supporting the bullish trend.
Momentum Indicators:
- RSI: The Relative Strength Index has been climbing, reaching levels above 50, indicating increasing buying pressure.
- Stochastic Oscillator: Both %K and %D have been in overbought territory, signaling a strong bullish momentum.
- Williams %R: The indicator has been hovering near oversold levels, suggesting a potential reversal to the upside.
Volatility Indicators:
- Bollinger Bands: The stock price has been trading within the upper Bollinger Band, indicating an overbought condition.
- Bollinger Band Width: The band width has been narrowing, suggesting a potential decrease in volatility.
- Bollinger Band %B: The %B indicator has been above 0.8, indicating a high price relative to the bands.
Volume Indicators:
- On-Balance Volume (OBV): The OBV has been trending upwards, indicating accumulation by investors.
- Chaikin Money Flow (CMF): The CMF has been positive, reflecting buying pressure in the stock.
Key Observations:
- The trend indicators suggest a strong bullish sentiment, supported by the moving averages and MACD.
- Momentum indicators indicate a continuation of the bullish momentum, with overbought conditions in the stochastic oscillator.
- Volatility indicators point towards a potential decrease in volatility and a consolidation phase.
- Volume indicators show accumulation and positive money flow into the stock.
Conclusion:
Based on the analysis of the technical indicators, the next few days are likely to see continued upward movement in the stock price. The bullish trend supported by the moving averages, MACD, RSI, and stochastic oscillator indicates a strong buying sentiment in the market. While a consolidation phase or a minor pullback cannot be ruled out due to overbought conditions, the overall outlook remains bullish. Investors may consider buying on dips or holding onto existing positions to capitalize on the expected price appreciation.